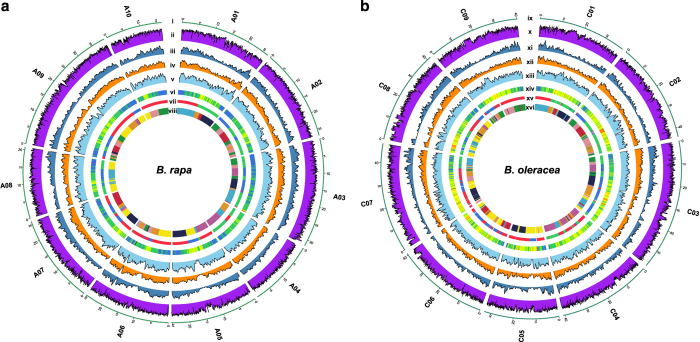
Figure 2. The distribution of genomic variations on chromosomes of the resequenced populations of 199 B. rapa and 119 B. oleracea accessions.
(a) The genomic information of the B. rapa population; i: the ten chromosomes of B. rapa, the physical positions are indicated in units of million bases; ii: the genomic heterozygosity of the B. rapa population. Area charts quantify iii: functional SNPs/InDels, iv: InDels, v: SNPs. vi: heat map for gene density. vii: subgenome partition of the B. rapa genome, red, green, and blue corresponding to subgenomes LF, MF1, and MF2, respectively10. viii: The triplicated 24 genomic blocks in B. rapa10. (b) The genomic information of the B. oleracea population; ix: the nine chromosomes of B. oleracea; x: the genomic heterozygosity of the B. oleracea population. Area charts quantify xi: functional SNPs/InDels, xii: InDels, xiii: SNPs. xiv: heat map for gene density. xv: subgenome partition in B. oleracea genome, red, green, and blue corresponding to subgenomes LF, MF1, and MF2, respectively5. xvi: The triplicated 24 genomic blocks in B. oleracea5. LF denotes the least fractionated subgenome, MF1 and MF2 denote for more fractionated sub-genomes 1 and 2 (ref. 3).

