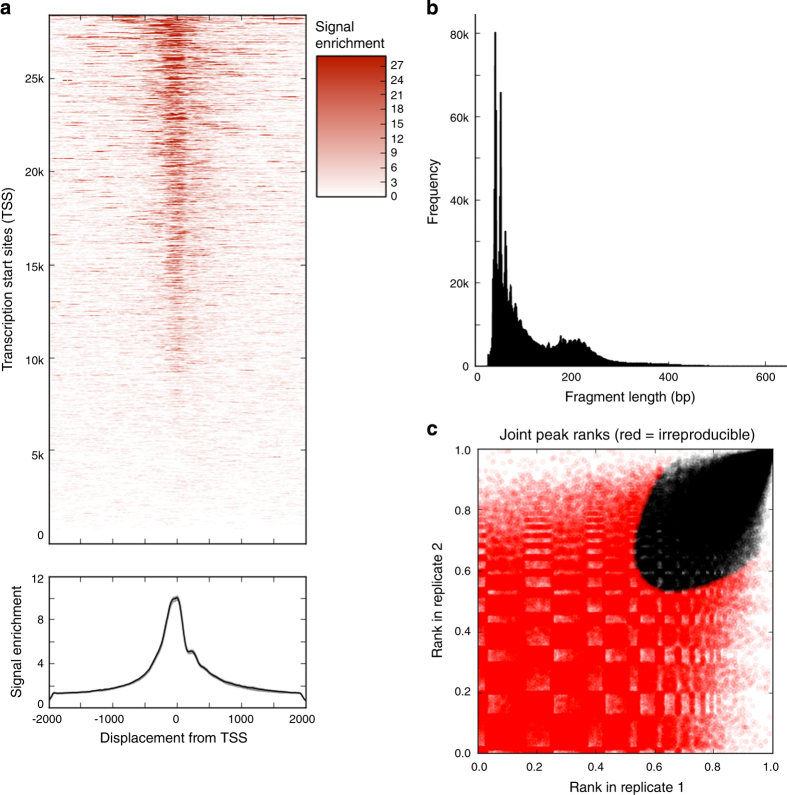
Figure 3. ATAC-seq data quality metrics.
(a). Enrichment of ATAC-seq signal around transcription start sites (TSS), shown for a representative sample (lateral mesoderm). Top: enrichment around individual TSS. Bottom: aggregated enrichment around all TSS's. (b). Fragment length distribution of ATAC-seq reads from a representative sample (lateral mesoderm). Most of the reads fall into the nucleosome-free region (<150 bp) and a clear mono-nucleosome peak can be seen. (c). Irreproducible rate (IDR) analysis of ATAC-seq peaks from lateral mesoderm. The scatter plot shows one point for every peak, with its location representing in rank in each replicate. For downstream analysis, we only consider peaks shown in black (reproducible at an IDR rate of 0.1), which have ranks that are consistent between replicates.

