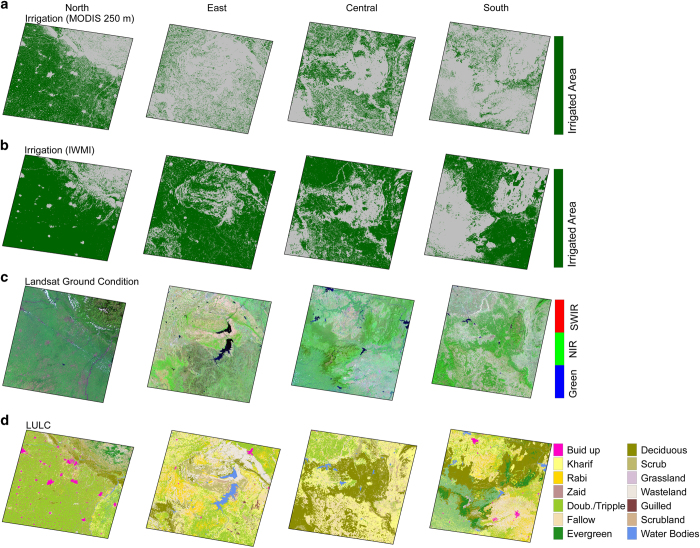
Figure 4. Comparison of irrigated area developed using 250 m MODIS NDVI and data from IWMI at the same spatial resolution for specific land use land cover classes.
(a) Irrigated area developed using the 250 m MODIS NDVI, (b) irrigated area from 250 m resolution map from IWMI, (c) Regional views depicted by Landsat ETM data, and (d) AWiFS Land Use Land Cover (LULC). Each column from left to right represent north, east, central and southern region of India.

