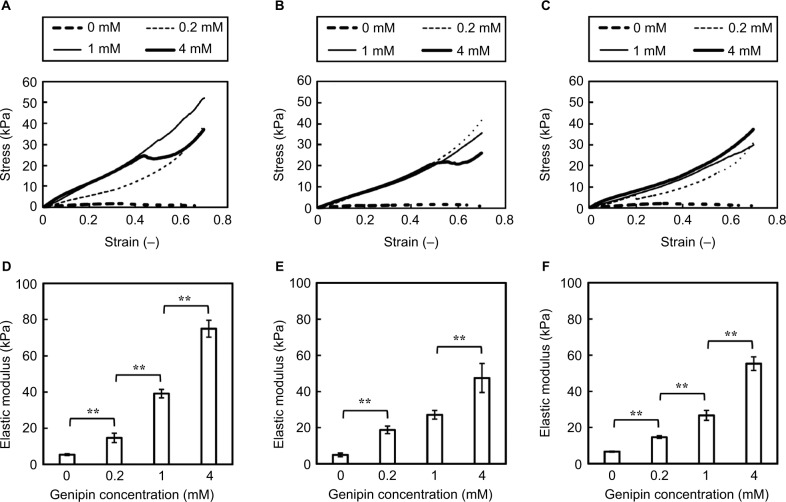
Figure 6.
Mechanical properties of collagen gels in penetration tests.
Notes: Representative stress–strain curves of 1.44% collagen gels in 1 × NPB (A), 1.6 × NPB (B), and 2 × NPB (C) after incubation at 37°C for 24 h. Numbers in the figure indicate genipin concentrations in sols. Elastic moduli of 1.44% collagen gels in 1 × NPB (D), 1.6 × NPB (E), and 2 × NPB (F) after incubation at 37°C for 24 h. Data are presented as mean ± SD (n=4). Horizontal bars indicate significant differences between samples (**p<0.01).
Abbreviations: NPB, neutral phosphate buffer; SD, standard deviation.

