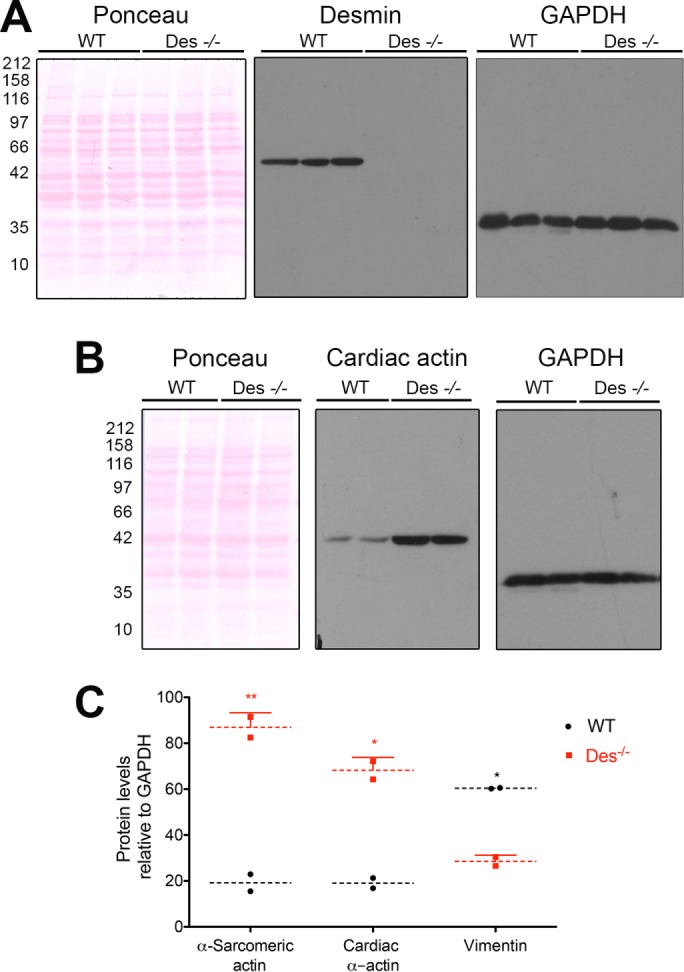
FIGURE 8:

Elevated cardiac actin levels in Des−/− mouse hearts. (A) Panel display the total protein content in ponceau-S–stained blot runs using lysates made from homogenized whole-tissue hearts dissected from WT and Des−/− Sv126 strain mice (n = 3 per group). Western blot shows desmin migratating at 52 kDa in WT hearts while absent entirely from Des−/− hearts. (B) Similar amounts of lysate loading are demonstrated with ponceau-S–stained blots. The protein levels of cardiac actin are significantly increased in Des−/− hearts compared with WT controls (n = 2 per group). (C) Graph displays the relative protein levels of α-sarcomeric actin, cardiac actin, and vimentin as quantified by band densitometry using ImageJ. Individual lanes were normalized to GAPDH levels. Significance between samples was determined using two-way analysis of variance (ANOVA; **, p < 0.01; *, p < 0.05).
