
FIGURE 6:
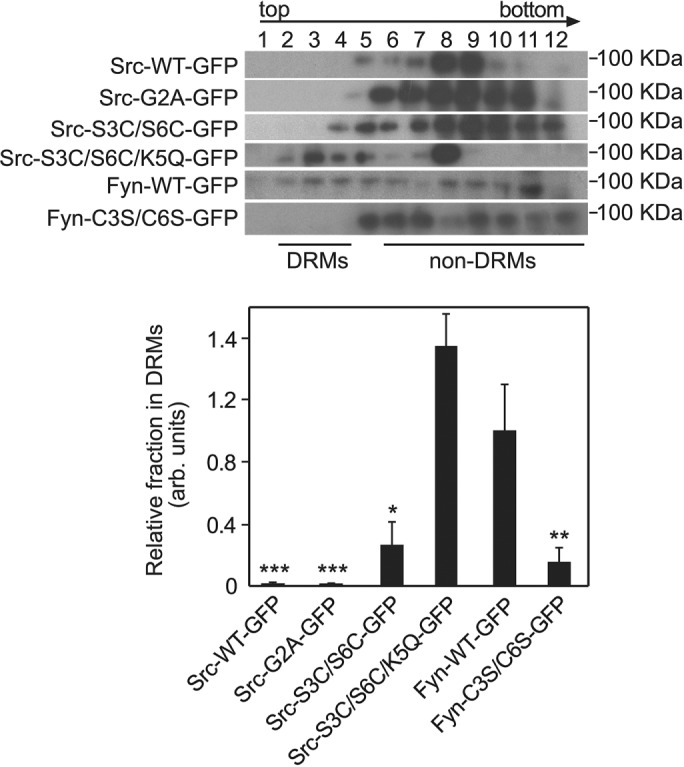
Distribution of Src and Fyn palmitoylation mutants to DRMs. Cells expressing the indicated Src-GFP or Fyn-GFP proteins were lysed and fractionated using a three-step sucrose gradient as described, resulting in DRMs in fractions 2–4 (Oneyama et al., 2009; see Materials and Methods). Fractions of 1 ml were collected from top (fraction 1) to bottom (fraction 12). After precipitation of the proteins by TCA, samples were subjected to Western blotting for GFP (see Materials and Methods), and the SFK-GFP bands were quantified by densitometry. (A) Typical results of a fractionation experiment. (B) Quantification (mean ± SEM, n = 3) of the fractions in DRMs. Results were normalized relative to the DRM fraction of Fyn-WT-GFP, which was assigned the value of 1. Asterisks designate significant differences between a given mutant and Fyn-WT-GFP (*, p < 0.05; **, p < 10−2; ***, p < 10−8; Student’s t test).