
Figure 5.
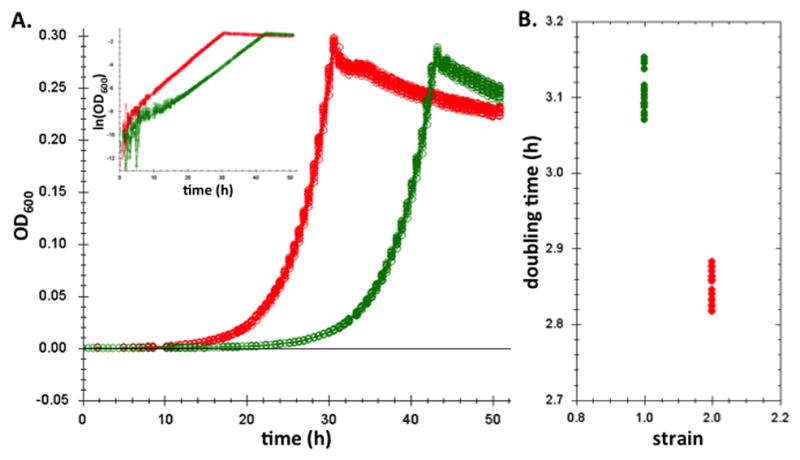
An example set of bacterial growth curves measured by Clarity. A.) The replicates represent a comparison of the optical density measured for over fifty hours for two isolates (red and green; 18 replicates of each) of a strain of Methylobacterium extorquens AM1 evolved during an evolution experiment from the same ancestor. Note in the inset the log-linear increase in density indicates the remarkable constancy of per-capita growth throughout these conditions. B.) Analysis of the doubling times of the two strains indicates the precision by which we can estimate this exponential rate.