FIGURE 1:
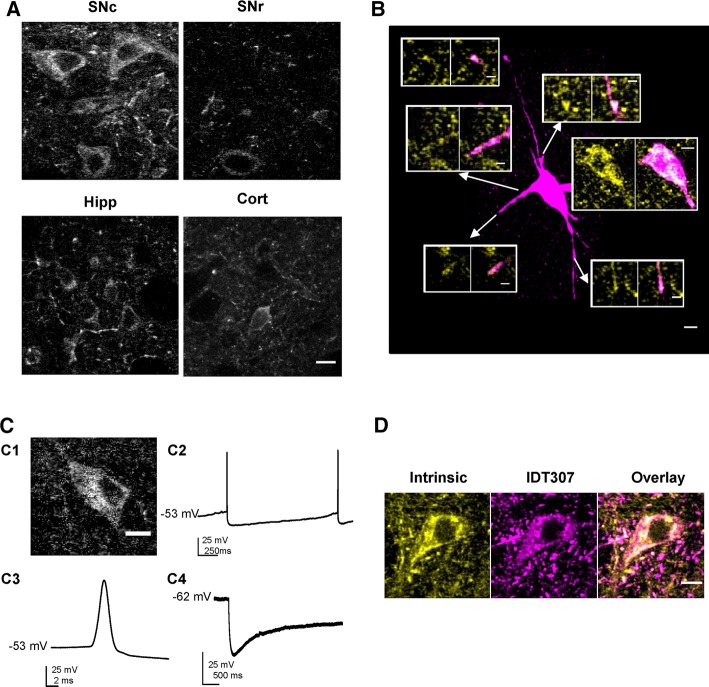
SN dopamine neurons display high autofluorescence. (A) Representative single-plane multiphoton images of SN pars compacta (SNc), substantia nigra pars reticulata (SNr), hippocampus (Hipp), and cortex (Cort) at matched depth and laser power. (B) Pseudocolored summed z-projection of a sulforhodamine B (magenta)–filled SN neuron. The insets are single-plane pseudocolored magnifications of autofluorescence (yellow; left) and sulforhodamine B/autofluorescence overlay (magenta/yellow; overlap indicated by white) in individual dendrites and the soma. (C) Somas of the SN with high autofluorescence exhibit electrophysiological characteristics of DA neurons. Representative single-plane image (C1) and current-clamp voltage traces of slow pacemaker activity (C2), broad action potentials (C3), and Ih voltage sag (held at −60 mV, followed by a 2-s, −250 pA current injection; C4) characteristic of DA neurons. (D) Representative single-plane pseudocolored images of autofluorescence (yellow) colocalization with monoamine neurons identified with IDT307 (fluorescent monoamine transporter substrate; magenta) in the SN. Scale bars, 10 μm (A–D), 5 μm (insets).

