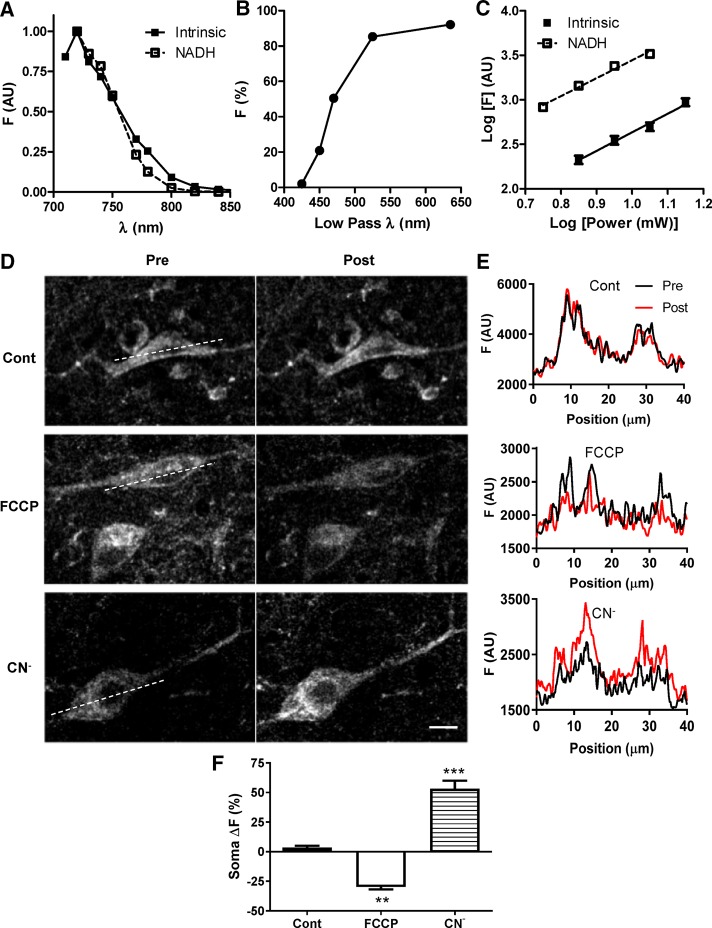
FIGURE 2:
Comparison of autofluorescence from DA neurons and NADH. (A) Multiphoton excitation spectra of SN soma autofluorescence (▪; N = 2) and 2.5 mM NADH (▫). (B) Autofluorescence emission spectrum of SN somas (N = 3). (C) Two-photon excitation of the autofluorescence and NADH. SN soma and 2.5 mM NADH were stimulated with increasing levels of power at 740 nm. The log of somatic F (▪; mean ± SEM for 12 cells) and of NADH F (▫; individual data points) is plotted against the log of laser power. The solid and dashed lines represent linear regression for autofluorescence (slope 2.09 ± 0.16) and NADH (slope 2.02 ± 0.17), respectively. (D) Representative two-photon single-plane images before (Pre) and after (Post) a 5-min treatment with vehicle (Cont), 1 μM FCCP, or 1 mM CN−. (E) Profile plots of NAD(P)H fluorescence of ROIs indicated by dashed lines in D (black, Pre; red, Post). (F) Quantification of percentage fluorescence change (ΔF) of soma autofluorescence in SN slices before (Pre) and after (Post) a 5-min treatment with vehicle (Cont), 1 μM FCCP, or 1 mM CN− (5–14 cells). *p < 0.05, **p < 0.01, ***p < 0.001. Scale bar, 10 μm.

