FIGURE 7:
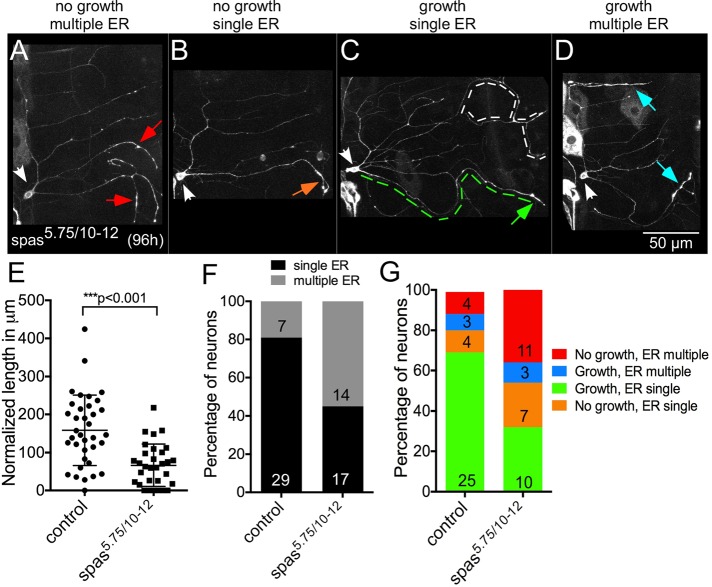
ER distribution during regeneration in spastin mutant neurons. ER accumulation patterns in class I ddaE neurons during injury-induced axon regeneration. White arrows indicate the ddaE cell body. (A) An injured neuron that failed to regrow and has Rtnl1-GFP accumulation in multiple neurites (red arrows), (B) an injured neuron with <75 μm of regrowth and Rtnl1-GFP accumulation in a single neurite (orange arrow), (C) an injured neuron with >75 μm of regrowth and Rtnl1-GFP accumulation in the regrowing neurite (green arrow; green dashed lines trace the new axon. White dotted lines show a dendrite from a neighboring neuron), and (D) an injured neuron with multiple neurites regrowing, each with Rtnl1-GFP accumulation in the tips (blue arrows). (E) Quantification of regeneration in control (yw) and spas5.75/10-12 neurons. Long and short horizontal bars indicate mean and SD respectively, and an unpaired t test was used to calculate significance. (F) Percentage of neurons with ER accumulation in single or multiple neurite tips in control and spas5.75/10-12 neurons. (G) Percentage of neurons with different categories of growth and ER accumulation patterns. Colors correspond to arrows in A–D.

