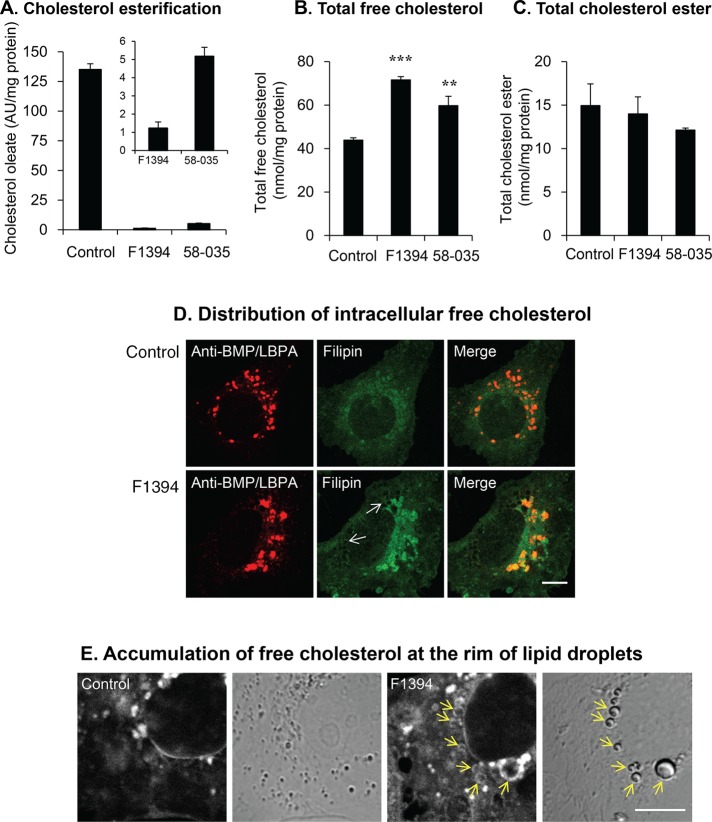
FIGURE 3:
ACAT inhibitors increase cellular free cholesterol. (A) Huh7 cells were treated as described in Figure 1A. Incorporation of [14C]oleate into cholesterol was measured as described in Materials and Methods. Results indicate mean ± SD (n = 3) of [14C]cholesteryl ester formed. (B) Cells were treated as in A. Total cellular free cholesterol was quantified using GC as described in Materials and Methods. ***p < 0.001, **p < 0.02. (C) Cells were treated as in A. Total cellular cholesterol ester was quantified using GC as described in Materials and Methods. (D) Cells were grown for 24 h in the absence (top) or presence (bottom) of 10 μg/ml F1394. Cells were then fixed and permeabilized by digitonin as described in Materials and Methods and doubly labeled with filipin and anti-BMP/LBPA antibody. Bar, 10 μm. (E) Cells were grown for 24 h in the absence (Control) or presence (F1394) of 10 μg/ml F1394. Cells were then fixed and permeabilized by freezing and thawing as described in Materials and Methods and stained with filipin. Bar, 10 μm.

