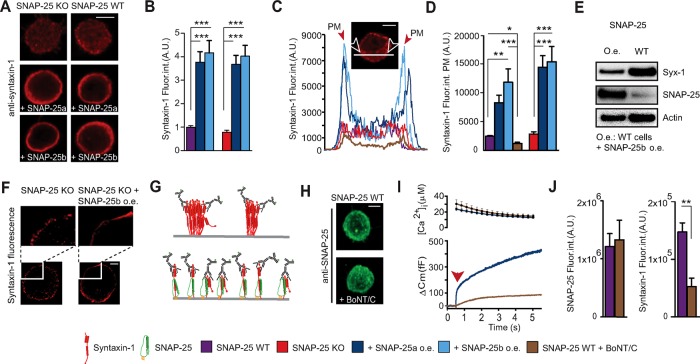
FIGURE 4:
Overexpressing SNAP-25 increases syntaxin-1 immunoavailability but not its expression level. (A) Confocal slices of WT and SNAP-25 KO adrenal chromaffin cells with or without SNAP-25a or SNAP-25b overexpression stained for syntaxin-1. Scale bar, 5 μm. (B) Quantification of syntaxin-1 immunostaining (Fluor. int., fluorescence intensity). Data are normalized to the syntaxin-1 signal from SNAP-25 WT cells. ***p < 0.001 (one-way ANOVA, Tukey’s post hoc test). (C) Representative profile plots of syntaxin-1 immunolabeling. The peaks in the plots (arrows) indicate the plasma membrane (PM). Inset, confocal midsection of a SNAP-25 KO cell, indicating how the profile was measured. Scale bar, 5 μm. (D) Quantification of syntaxin-1 immunolabeling at the PM from WT and SNAP-25 KO cells. *p < 0.05, **p < 0.01, ***p < 0.001 (one-way ANOVA, Tukey’s post hoc test). (E) Western blots showing the levels of syntaxin-1 and SNAP-25 in cultured adrenal chromaffin cells before and after overexpression of SNAP-25b. The syntaxin-1 level decreased, although the immunoavailability increased. (F) 3D-SIM showed that viral overexpression of SNAP-25b in SNAP-25 KO cells leads to recruitment of syntaxin-1 from PM clusters. Top, blow-ups of part of the membranes from a SNAP-25 KO cell and a SNAP-25 KO cell overexpressing SNAP-25b. Scale bar, 2 μm. (G) Schematic illustration of the limited immunoavailability of syntaxin-1 in clusters (top) and an increased immunoavailability after overexpression of SNAP-25 (bottom), which results in recruitment of syntaxin from PM clusters. (H) Confocal maximum projections of WT cells with and without BoNT/C1 stained for SNAP-25. Scale bar, 5 μm. (I) The effect of BoNT/C was tested on secretion in SNAP-25 WT cells in a calcium uncaging experiment (flash at arrow), verifying that secretion was strongly depressed. (J) Quantification of the SNAP-25 and syntaxin-1–specific signal after cleavage of syntaxin-1 by BoNT/C. **p < 0.01 (Student’s t test, two-tailed). N = 2, n = 15–19.

