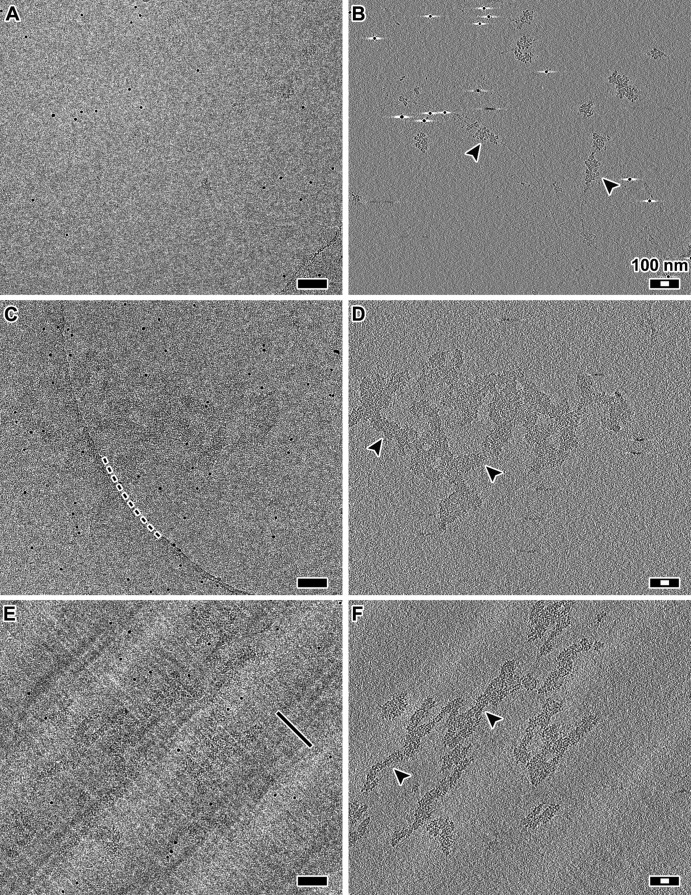
FIGURE 1:
The 30-nm fibers are compact and remain intact in cryosections. (A) Projection image of chicken erythrocyte 30-nm fibers plunge-frozen in dialysis buffer plus 2 mM Mg2+. (B) Tomographic slice (12 nm thick) of the position in A. Arrowheads indicate examples of 30-nm fibers. (C) Projection image of chicken erythrocyte 30-nm fibers plunge-frozen in the presence of dextran. Note that due to the low dose (∼2 electrons/Å2 per projection) and relatively small defocus (−6 μm), the 30-nm fibers are difficult to see. The dark, punctate densities are 10-nm gold fiducials. The curved dashed line marks the edge of the holey carbon support. (D) Tomographic slice (12 nm thick) of the position in C. Arrowheads indicate examples of 30-nm fibers. (E) Projection image of a frozen-hydrated section containing 30-nm fibers. Knife marks are thin linear features that are parallel to the cutting direction, as indicated by the black line. (F) Tomographic slice (12 nm thick) of the same area as in E. Arrowheads indicate examples of 30-nm fibers. The alternating light-dark background bands running from the lower left to upper right of C and D are crevasse artifacts, which are visible due to the proximity of the tomographic slice to the cryosection surface. Scale bars, 100 nm (black), 30 nm (white).

