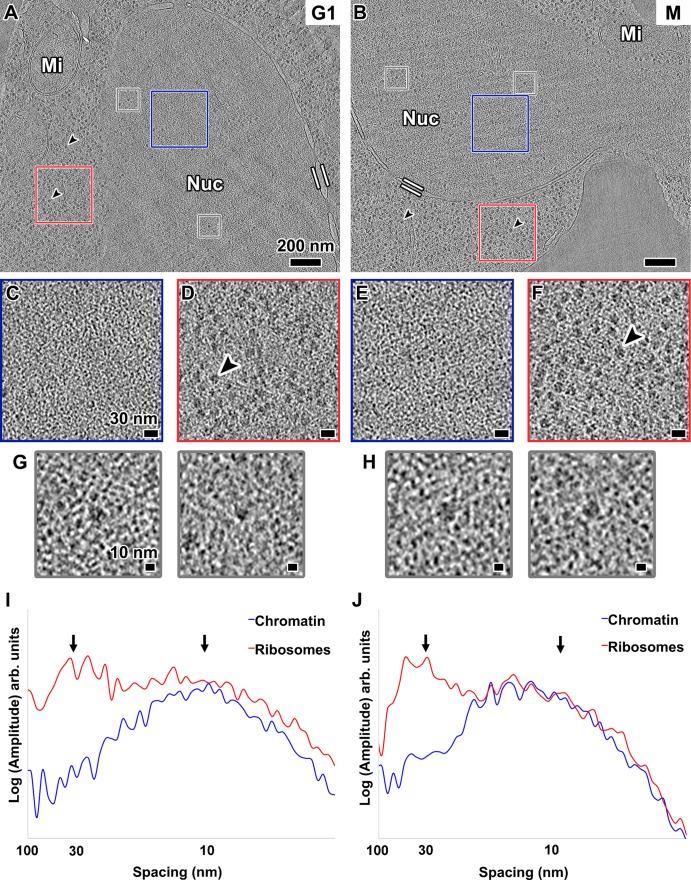
FIGURE 2:
Chromatin is not organized as 30-nm fibers in yeast. Tomographic slices (30 nm thick) of yeast nuclei in (A) G1 and (B) metaphase (M) cells. The nuclei (Nuc) and mitochondria (Mi) are labeled. Parallel white bars mark inner and outer nuclear membranes. Black arrowheads point to cytoplasmic ribosomes. Scale bars, 200 nm. (C, E) Enlargements (threefold) of the intranuclear positions enclosed by blue boxes in A and B, respectively. (D, F) Enlargements (threefold) of cytoplasmic ribosomes enclosed by red boxes in A and B, respectively. Scale bars, 30 nm. (G, H) Examples of intranuclear ribosome-sized densities boxed out (gray) from A and B, respectively, and enlarged sixfold. Scale bars, 10 nm. (I, J) Rotationally averaged power spectra of chromatin- and ribosome-rich positions from C and D, and E and F, respectively. Arrows point to 30- and 10-nm spacings.

