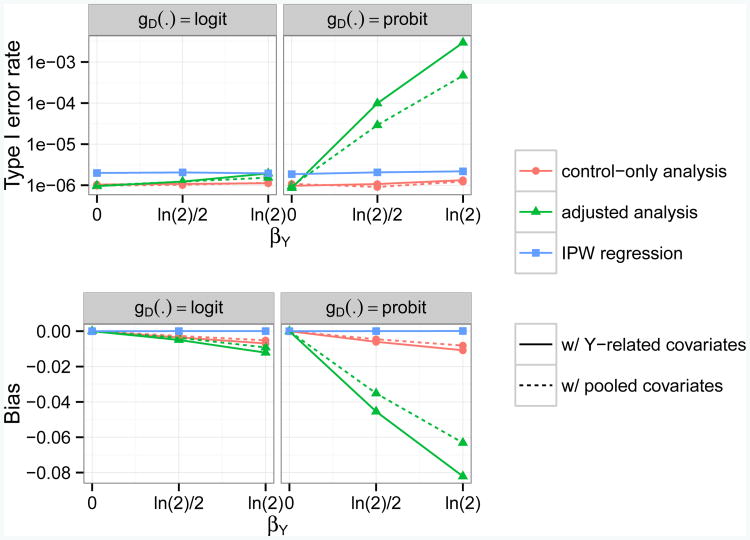
Fig 3.
Empirical type I error rates and bias for testing and estimating genetic associations with a continuous secondary trait, at genome-wide α = 10−6 level and across null scenarios (αG = 0) with different combinations of βY and link function gD(·) for the disease model. Five methods (Analysis 2,4,6,8,9) are compared here. Each method takes either a control-only, adjusted, or IPW approach, and adjusts for covariates related to Y or covariates related to (Y, D). The disease is assumed to be rare (1% prevalence) and to follow either a logistic or probit model (gD(·) = logit or Φ−1). G is assumed to be associated with D (βG = ln 1.7). Z1 is assumed to be a confounder of the association between G and D (γ1 = βZ1 = ln 1.7). The scenarios with a logistic disease model (left column) are the same as the scenarios in the bottom right plots of Figures 1 and 2, except here the disease is not common but rather rare.

