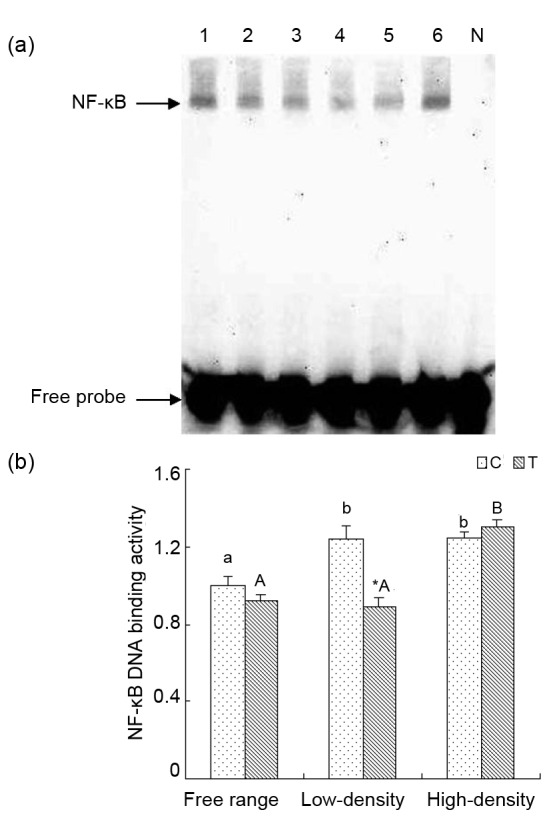
Fig. 5.

Effect of taurine on NF-κB DNA binding activity by EMSA analysis in renal tissue from laying hens
(a) Lanes 1 and 2 are control and treatment groups in free range environment; Lanes 3 and 4 are control and treatment groups in low-density caged environment; Lanes 5 and 6 are control and treatment groups in high-density caged environment; Lane N is negative control. (b) Results of statistical analysis for NF-κB DNA binding activities. Data are presented as the mean±SEM (n=10). * P<0.05, significant difference between the control and treatment groups in the same rearing pattern. Superscripts not sharing a common letter differ significantly (small letter for control groups and capital letter for treatment groups) at P<0.05
