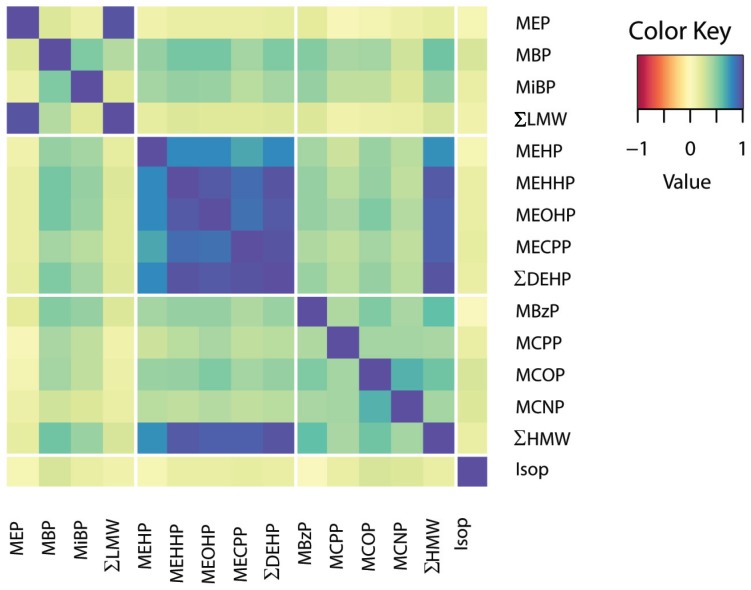
Figure 2.
Correlation matrix of concentrations between eleven phthalate metabolites and isoprostane averaged for two time points in early and late pregnancy. Each colored square represents Pearson’s correlation coefficient between different phthalate metabolites. The dark blue squares indicate strong positive correlations with correlation coefficients ranging from 0.5–1.

