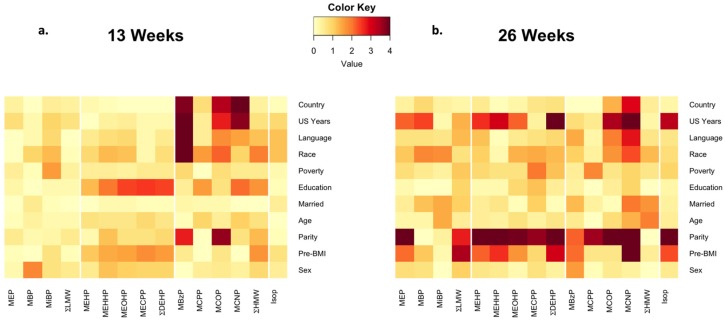
Figure 3.
Heatmap of the relationship between phthalate metabolite concentrations and demographic variables at (a) 13 and (b) 26 weeks gestation. Each colored square represents the −log10 p-value for the association of demographic variables (using the same categories as Table 1) with phthalate metabolites concentrations as determined by analysis of variance (ANOVA). The darker squares represent associations with smaller p-values, with dark red representing the most significant associations (p ~ 1 × 10⁻⁴). Each model is adjusted for creatinine by including it as a covariate.

