. 2016 Nov 9;9(12):3783–3793. doi: 10.1039/c6ee02598f

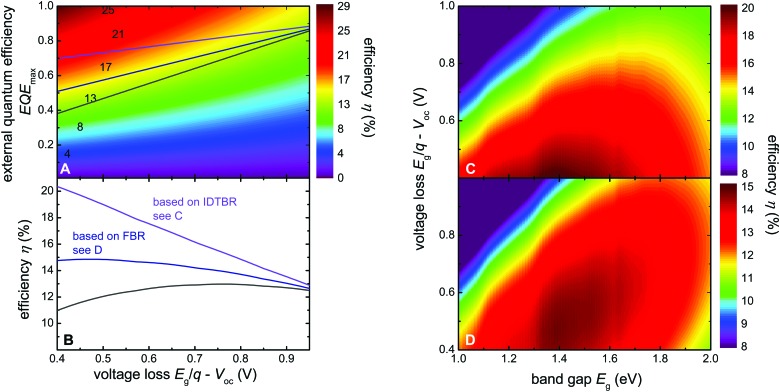
Fig. 6. Efficiency potential simulated as a function of voltage loss and maximum EQE. (A) Maximum possible efficiency as a function of the EQEmax and the voltage loss. The three lines correspond to the lines in Fig. 1 and represent the empirical trend given by ref. 4 and the trend given by the present result (blue and violet lines). (B) The efficiency vs. voltage loss that can be obtained on the three lines. Notably, the new result shifts the point of maximum efficiencies to very low voltage losses (<0.5 V), while the earlier empirical line led to a maximum efficiency at voltage losses in the range of 0.7 to 0.8 V which corresponds to current record cells like PffBT4T-2OD:PC71BM.36 (C) Efficiency as a function of band gap and voltage loss assuming an EQEmax given by the violet lines in (A) and (B) and the highest possible FF for a solar cell without any resistive losses. (D) The same as (C) but for the blue line.

Fig. 6