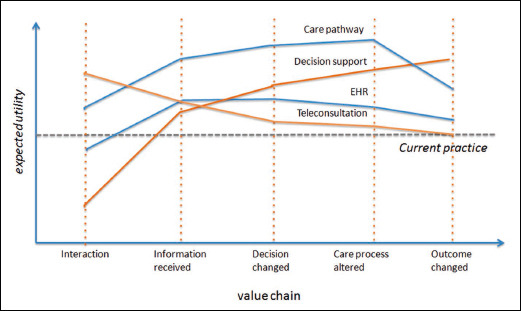
Fig. 3.

The expected utility for a technology intervention may vary at any step in the information value chain. This figure illustrates hypothetical expected utility profiles for four different classes of technology interventions compared to a common non-technological baseline. An intervention (i) may improve the quality of interactions in a health service but provide little additional information compared to current practice (e.g. teleconsultation); (ii) may optimize the quality of information capture (e.g. Electronic Health Record); (iii) may improve the quality and efficiency of clinical processes (e.g. electronic care pathways) or (iv) may intervene directly in the decision-making process to improve clinical outcomes (e.g. decision support systems). Some portions of the profile may dip, and show a net cost rather than benefit (e.g. interacting with EHRs requires more time than normal for doctors). (From Guide to Health Informatics (3rd Ed.) [4])
