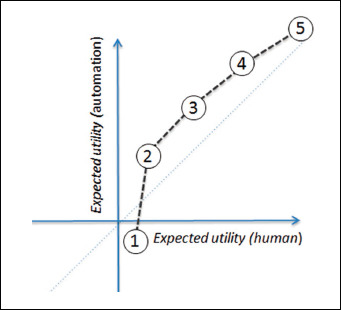
Fig. 6.

For a given technology, the expected utility (EU) of completing a given task by human or computer can be plotted over task space. Figure 2 broke the information value chain down into 5 separate tasks (numbered one to five here). Here, the hypothetical profile for current generation electronic health records from Figure 3 is replotted into task space. The curve described by such plots is a function of the given task, the specific technology implementation, the human user, and the context of use. The shape of the plot varies by changing any of these four variables.
