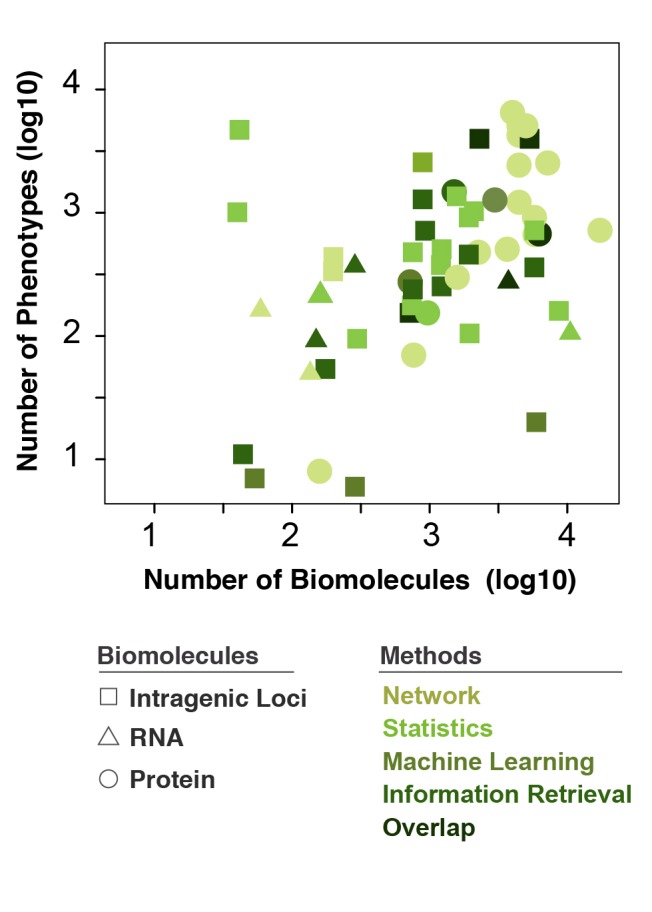
Fig. 3.

Computational methods based on the number of biomolecular and phenotypic inputs. Distribution of the types of methods widely changes according to the number of biomolecular and phenotypic/disease inputs. A few patterns are recognizable: (i) the predominant method utilizing proteins (circles) is “networks”, (ii) very few methods employ RNA (triangles), (iii) big datasets with ~104 biomolecules and as many phenotypes predominantly rely on proteins and to a lesser extent intragenic loci, and (iv) no studies comprised intergenic loci for imputation of similarity thus none shown in the legend.
