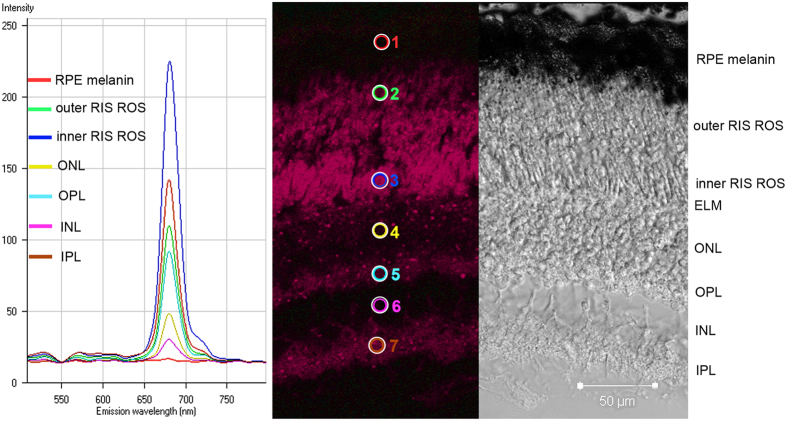
Figure 5. Fluorescence emission spectra from different regions of a Malacosteus niger retina.
The left panel shows the fluorescence spectra recorded from the different regions of a retinal section. The middle panel shows a fluorescence image resulting from excitation at 488 nm, with locations (circles) from which emission spectra were recorded. The right panel shows a DIC image of the same field of view. The emission spectra have characteristics typical of chlorophyll-like compounds. Fluorescence is most apparent in the rod outer and inner segment layers and the inner and outer plexiform layers. The signal is weaker from other layers of the retina. All labels as in Fig. 1.

