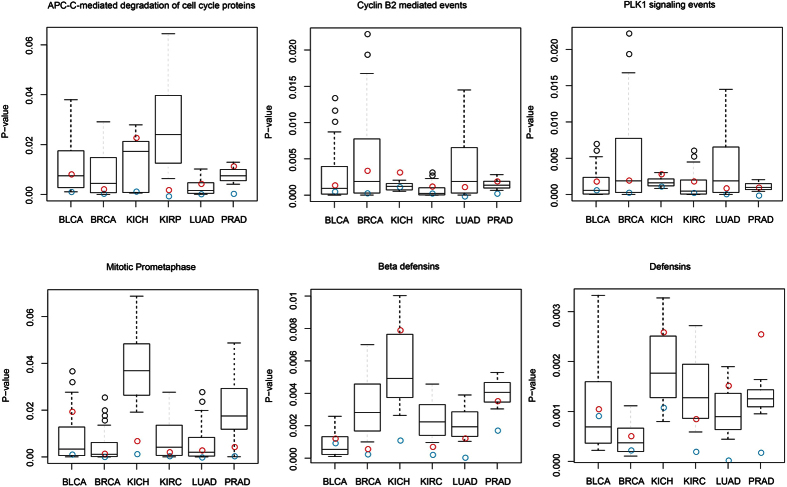
Figure 1. The 3% of the smallest permutation p values of 23 cancer risk lncRNAs.
(A) The 3% of the smallest permutation p values in BLCA. (B) BRCA. (C) KICH. (D) KIRC. (E) LUAD. (F) PRAD. In the boundary of the 3% of the smallest permutation p values in six cancer datasets, the blue open circles and red open circles are the real p value of 23 cancer risk lncRNAs and the real p value of entire lncRNAs in six cancer risk pathways, respectively. The p values of 23 cancer risk lncRNAs were smaller than the p value of entire lncRNAs for each cancer risk pathway.

