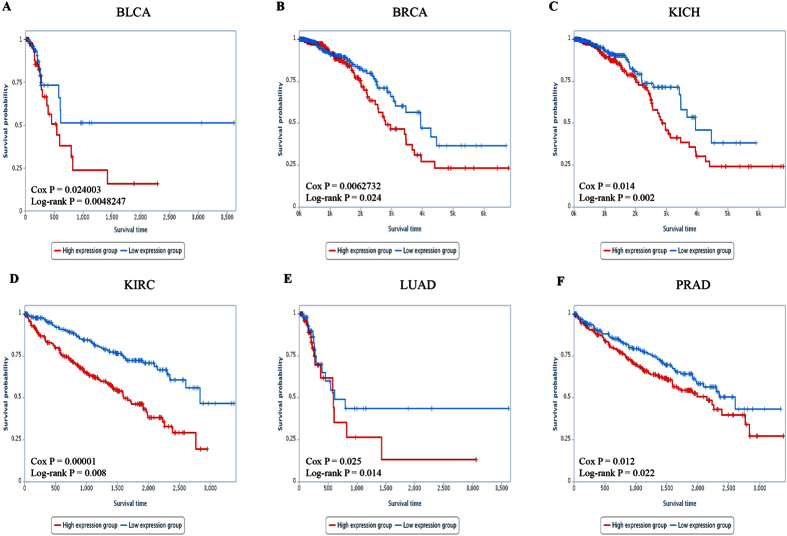
Figure 4. Survival ananlysis of six cancer datasets.
Kaplan-Meier curve for overall survival of two samples groups with higher (top 50%) or lower (bottom 50%) expression of 23 cancer risk lncRNAs in (A) BLCA. (B) BRCA. (C) KICH. (D) KIRC. (E) LUAD. (F) PRAD. The blue curve indicates higher expression group and the red curve indicates lower expression group.

