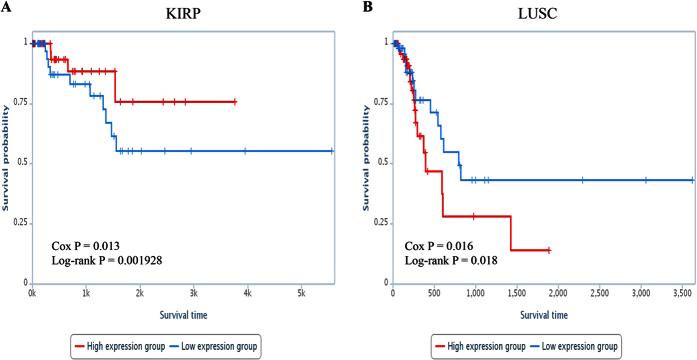
Figure 6. Survival ananlysis of KIRP and LUSC.
Kaplan-Meier curve for overall survival of two samples groups with higher (top 50%) or lower (bottom 50%) expression of 23 cancer risk lncRNAs in (A) KIRP. (B) LUSC. The blue curve indicates higher expression group and the red curve indicates lower expression group.

