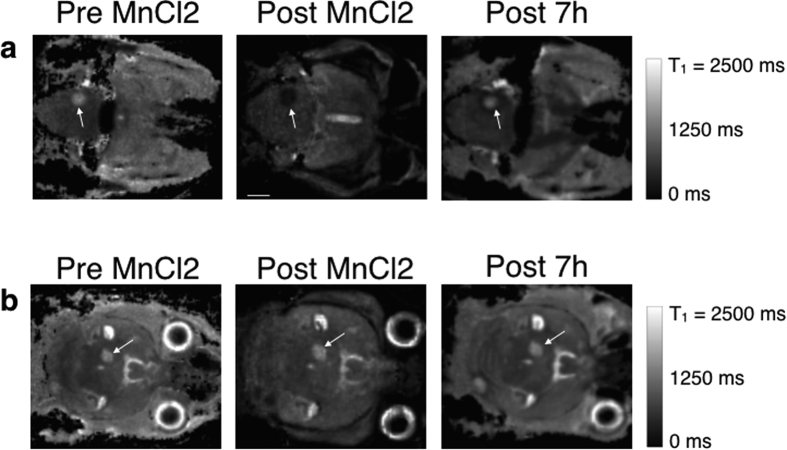
Figure 2. 3D T1 maps of a mouse brain with metastases over time after the MnCl2 injection.
Two slices showing two metastases (arrows) with similar volumes are shown. The metastasis in (a) took up Mn2+ ions, whereas the T1 of the metastasis pointed out in (b) remained stable over time. The scale bar represents 2 mm.

