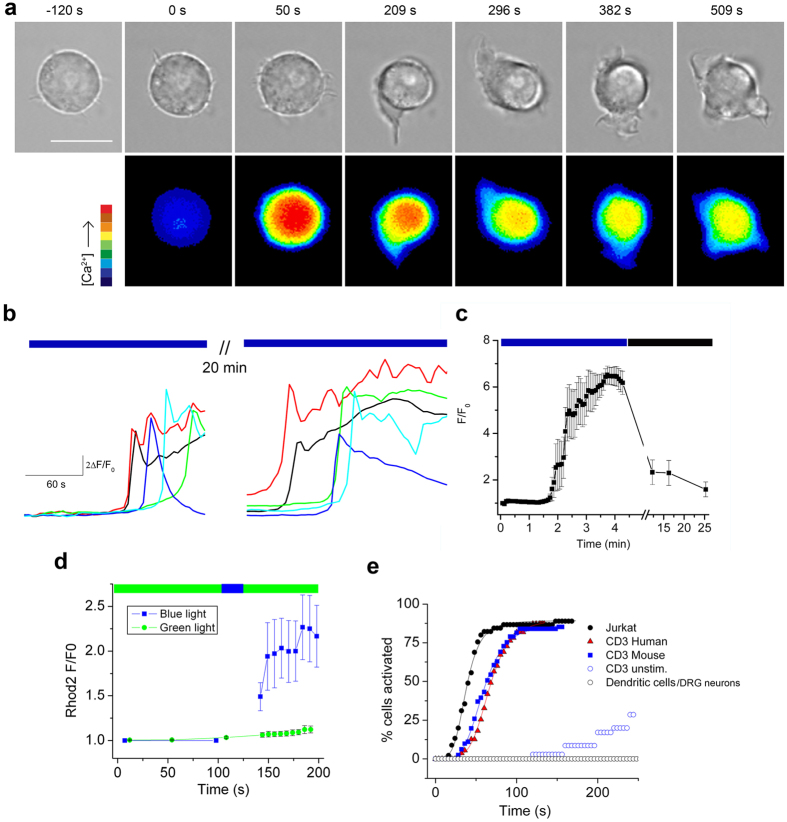
Figure 1. Blue light increases intracellular [Ca2+] in T cells.
(a) Phase (561 nm) and Fluo-4 fluorescence (488 nm, average 2.7 mW cm−2, 37 °C) images of a Jurkat cell show light-induced increase in intracellular [Ca2+] followed by extension of lamellipodia. Scale bar = 10 μm. (b) Representative traces of Fluo-4 fluorescence (F/F0) in Jurkat cells during irradiation with 20 mW cm−2 blue light (480 ± 15 nm) and after 20 minutes recovery (in dark). (c) Mean Fluo-4 fluorescence during blue-light irradiation (20 mW cm−2) and recovery in dark; n = 20. (d) Brief blue-light stimulation (27 mW cm−2, 20 s) increases Ca2+ measured by Rhod-2 fluorescence (excitation 540.5 ± 12.5 nm, 3 mW cm−2, n = 10 cells) (e) Comparison of light sensitivity in T cells (blue light, 17 mW cm−2, 31 °C). Plot shows the cumulative% of cells activated (>20% change from baseline) by continuous blue-light irradiation measured from 2 s bins (n = 30–50 cells per group). Smooth lines are best fits to a Hill function used to obtain the time for half-maximal activation (T1/2); Jurkat (38 s), Con A-stimulated human CD3+ (59 s), Con A-stimulated mouse CD3+ (66 s) cells, un-stimulated mouse lymph node CD3+ cells, mouse bone-marrow derived dendritic cells and DRG neurons (no response).

