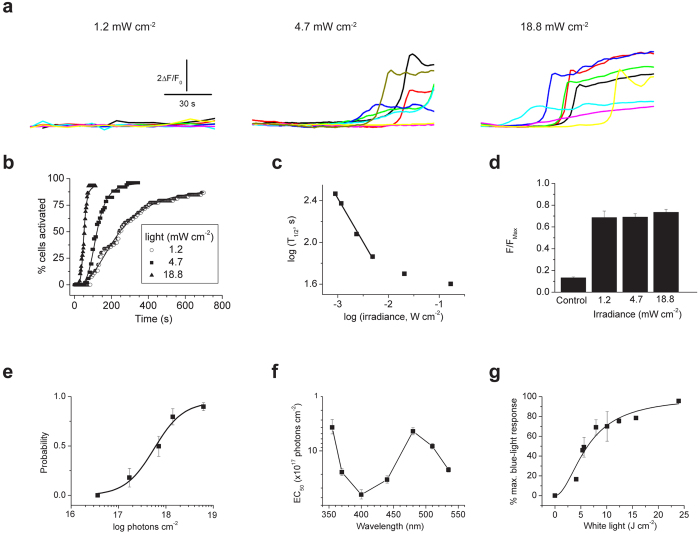
Figure 2. Energy and spectral dependence of T-cell light signaling.
(a) Fluo-4 fluorescence (F/F0) in Jurkat cells during 90 s irradiation with 1.2, 4.7 and 18.8 mW cm−2 blue light (480 ± 15 nm). (b) Cumulative% of cells activated by continuous blue-light irradiation measured from 2 s bins (n = 30–50 cells per group). Smooth lines are best fits to a Hill function used to obtain the time for half-maximal activation (T1/2). (c) Plot of log T1/2 versus log irradiance. The linear fit shows that T1/2 is proportional to irradiance at low energy (d) Peak Fluo4 fluorescence (normalized to ionomycin, FMax) evoked by different irradiances (2–20 minutes). Data are mean of 10–13 cells per group. Control represents F at time zero. (e) Fraction of cells responding to varying doses of blue-light irradiation (60 s, 31 °C, n = 40–50 cells for each point). Half-maximal activation (EC50) is 5.6 ± 1.2 × 10¹⁷ photons cm−2 or 232 mJ cm−2. (f) Plot of EC50 values for Ca2+ rise evoked by irradiation of different wavelengths; n = 40–60 cells for each point. (g) Changes in Fluo-4 fluorescence evoked by broad-spectrum (400–700 nm) irradiation. Data (30–50 cells) are normalized to maximal response evoked by blue light. Smooth line shows best fit to a Hill equation with an IC50 of 6.7 ± 0.6 J cm−2.

