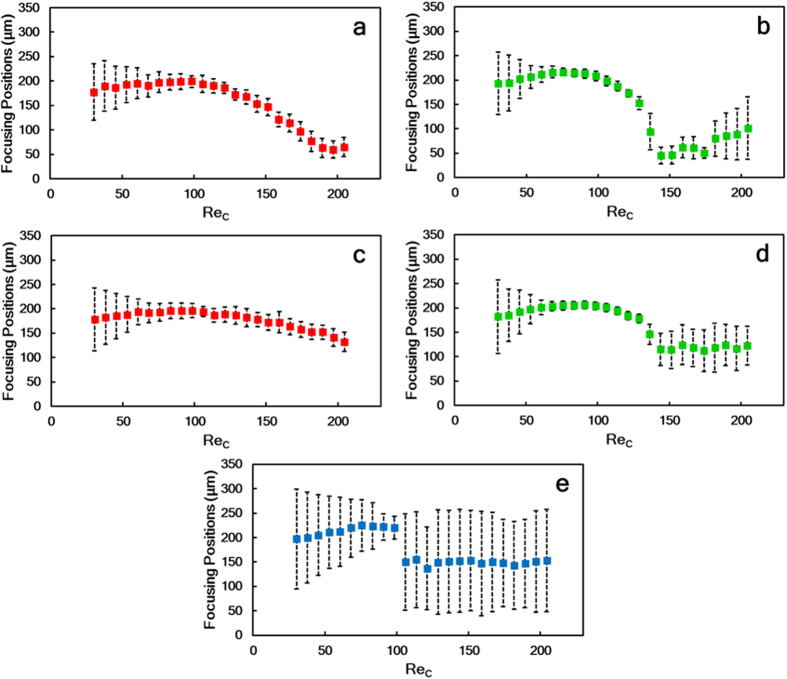
Figure 2.
Focusing positions of microparticles of three different sizes for the curved microchannel with varying flow rates and corresponding channel Reynolds numbers in the two aforementioned regions: the outlet region for particles of sizes (a) 20 μm (red), (b) 15 μm (green), (c) 10 μm (blue) and the transition region for (d) 20 μm (red) and (e) 15 μm (green) particles. Plotted error bars indicate the width of the focusing streak.

