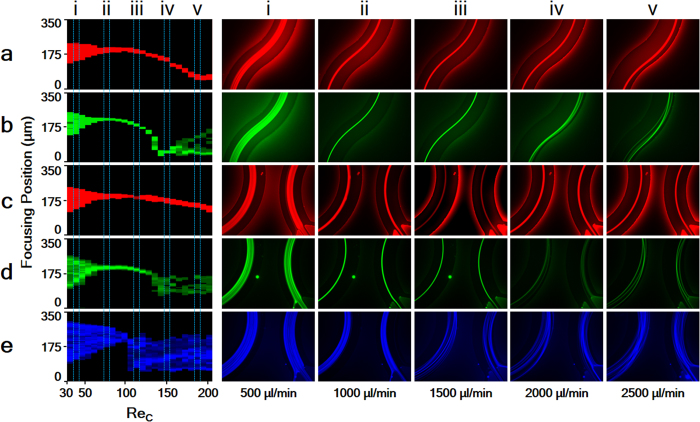
Figure 3. ReC maps: at the transition region for (a) 20 μm (red) and (b) 15 μm (green) particles and at the outlet region (c) 20 μm (red), (d) 15 μm (green) and (e) 10 μm (blue) particles.
Particle streams for different channel Reynolds numbers corresponding to five selected flow rates between 500 and 2500 μL/min (i–v).

