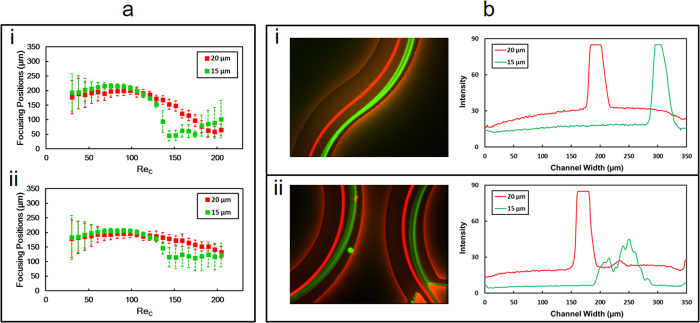
Figure 4.
(a) Particle lateral position data from both 15 μm and 20 μm particles in the transition region (i) and in the outlet region (ii). (b) particle streams of 20 μm (red) and 15 μm (green) particles in the channel transition region (i) and in the outlet region (ii) when ReC is 144; the corresponding intensity line graphs are presented to the right of each panel.

