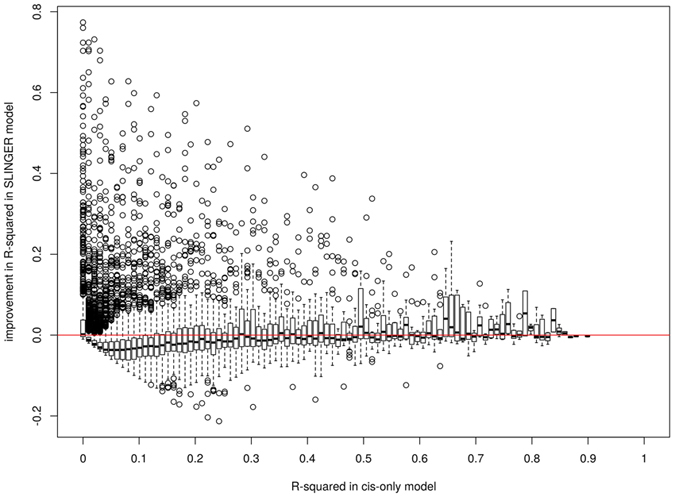
Figure 2. Gene-level gain in accuracy with unrestricted SLINGER models.

We report model performance for 13,825 genes present in the Depression Genes and Networks (DGN) dataset. r2 measures for PrediXcan models are binned in 101 subsets along x-axis. The difference between r2 values for SLINGER and PrediXcan models are represented on the y-axis. The red line corresponds to a no-gain case and everything above represents a gain when the unrestricted model is used.
