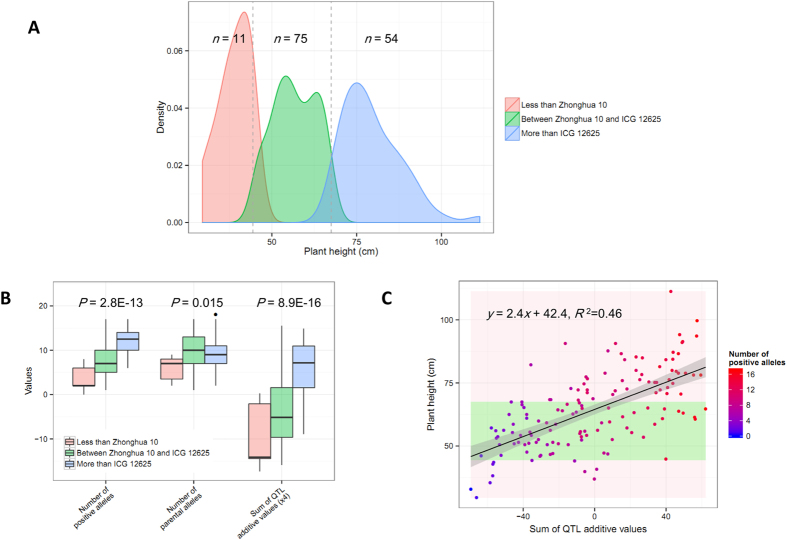
Figure 4. Transgressive segregation of plant height and allelic recombination in RIL population.
(A) The distribution of plant height for lines belonging to the three groups. The lines from the group ‘less than Zhonghua 10’, ‘between Zhonghua 10 and ICG 12625’, and ‘more than ICG 12625’, were indicated by different colors, respectively. The dashed vertical lines indicated the phenotypic value of Zhonghua 10 (left) and ICG 12625 (right). (B) The difference of allele counts and additive values among three phenotypic groups. (C) The scatterplot of plant height against to total QTL additive values in the RIL population. The color gradient means the counts of positive alleles harbored in each RIL line.

