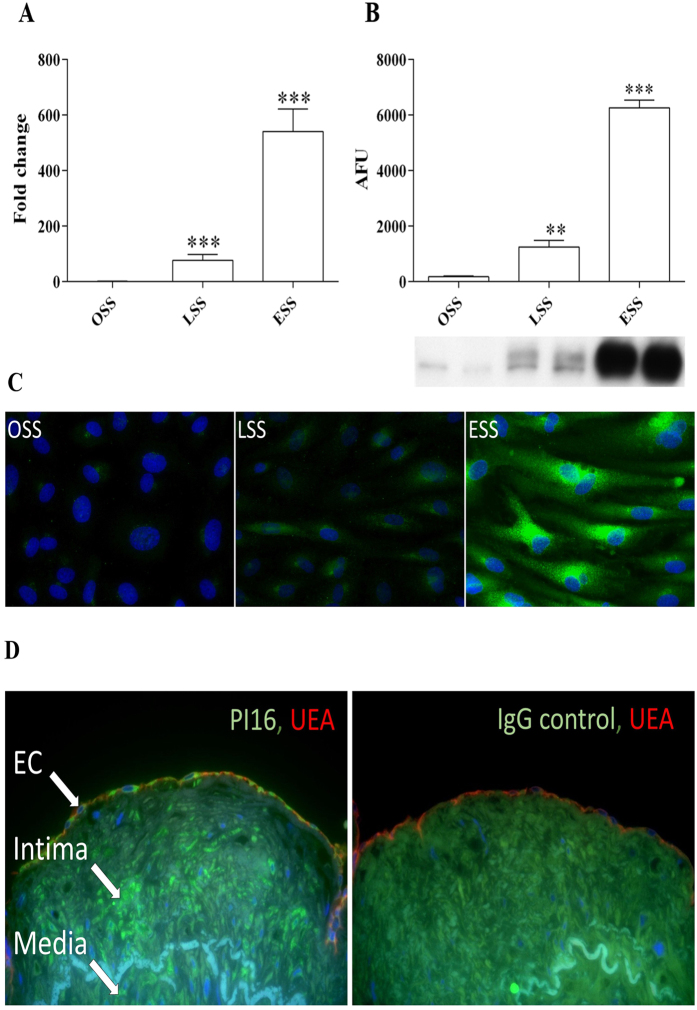
Figure 1. PI16 expression is increased by shear stress in HCAEC and is expressed in human coronary arteries.
Reulation of mRNA (A) and protein (B) expression in HCAEC flowed for 72 h (n = 6; **P < 0.01, ***P < 0.001 compared to OSS control). (C) ICC staining corroborates western analysis, with highest PI16 expression (green) in cells exposed to ESS (blue DAPI stain highlights cell nuclei). (D) IHC analysis revealed PI16 staining (green) in ECs (endothelial cell marker, UEA in red). DAPI staining was used to demarcate the nuclei (blue).

