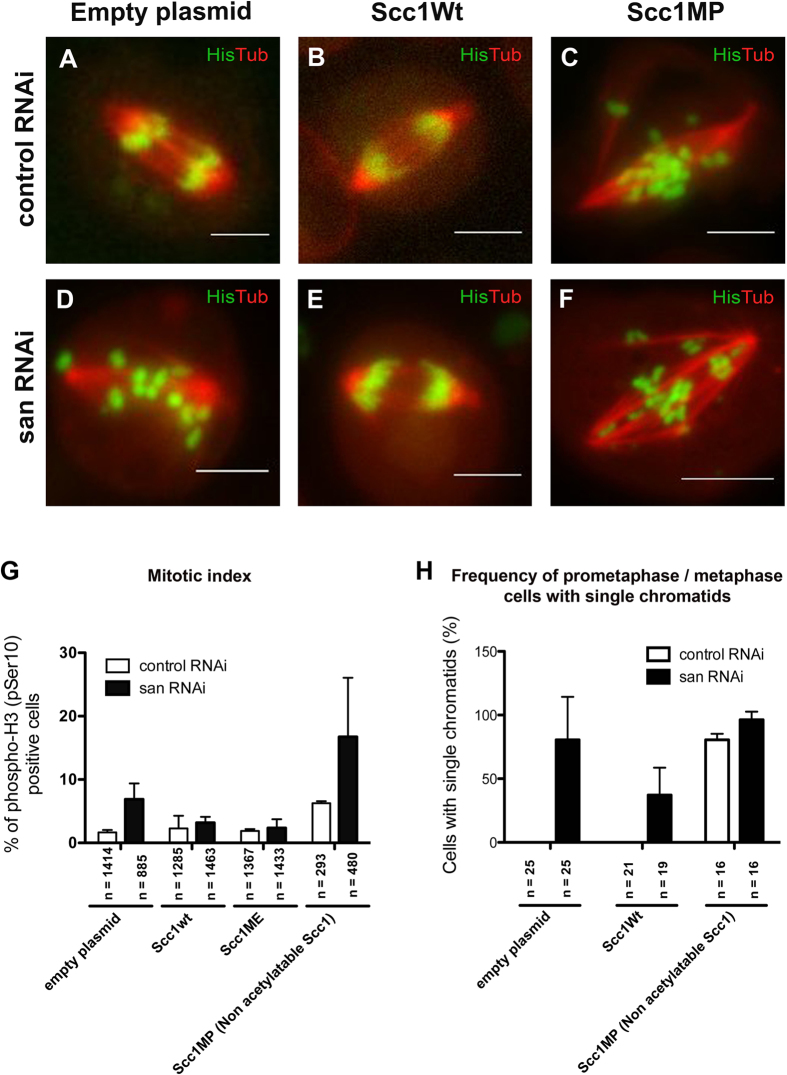
Figure 7. Ectopic expression of Scc1 suppress the mitotic defects observed after depletion of Naa50/San.
All cells in this figure were analyzed for 96 hours after RNAi-treatment. (A–F) Selected frames from time-lapse videos (see Movies S11,S12,S13,S14,S15,S16) of control RNAi and san RNAi-treated S2 cells that were transiently expressing an empty plasmid, wild type Scc1, or mutant Scc1 (Scc1MP). (G) Mitotic index of control RNAi and san RNAi-treated cells, when carrying an empty plasmid (pHW) was respectively 1.7% ± 0.3 (n = 1414) and 6.9% ± 2.0 (n = 885); when transiently expressing wild type Scc1 (Scc1Wt) it was, respectively, 2.3% ± 1.6 (n = 1285) and 3.2% ± 0.7 (n = 1463); when transiently expressing the mutant variant Scc1ME it was, respectively, 1.9% ± 0.2 (n = 1367) and 2.4% ± 1.1 (n = 1433); when transiently expressing mutant variant Scc1MP it was, respectively, 6.2% ± 0.3 (n = 293) and 16.7% ± 9.3 (n = 480). The following mitotic index differences are statistically significant: for control RNAi comparing to san RNAi treated cells, both carrying an empty plasmid; san RNAi treated cells with an empty plasmid comparing to san RNAi treated cells transiently expressing wild type Scc1 or the mutant variant Scc1ME (p < 0.05 Student’s t-test). (H) The frequency of metaphase cells with single chromatids in control RNAi and san RNAi-treated cells, when carrying an empty plasmid (pHW), was respectively, 0% (n = 25) and 85.0% ± 29.1 (n = 25); when transiently expressing wild type Scc1 (Scc1Wt) it was, respectively, 0% (n = 21) and 37.1% ± 21.5 (n = 19); when transiently expressing mutant variant Scc1MP it was, respectively, 80.6% ± 4.8 (n = 16) and 96.3% ± 6.4 (n = 16). The following differences in the frequency of metaphase cells with single chromatids are statistically significant: for control RNAi comparing to san RNAi-treated cells, both carrying an empty plasmid (pHW), a wild-type Scc1 (Scc1Wt), or the mutant variant Scc1MP; for san RNAi treated cells with an empty plasmid, comparing to san RNAi treated cells transiently expressing wild type Scc1 (Scc1Wt) (p < 0.05 Student’s t-test). Drosophila S2 cells stably expressed GFP-Histone H2B (green) and α-Tubulin-mCherry (red) (A–F)70. All images were obtained using maximum intensity projections of Z-stacks (0.8 μm stacks of 5 sections each). Scale bars equals 10 μm.

