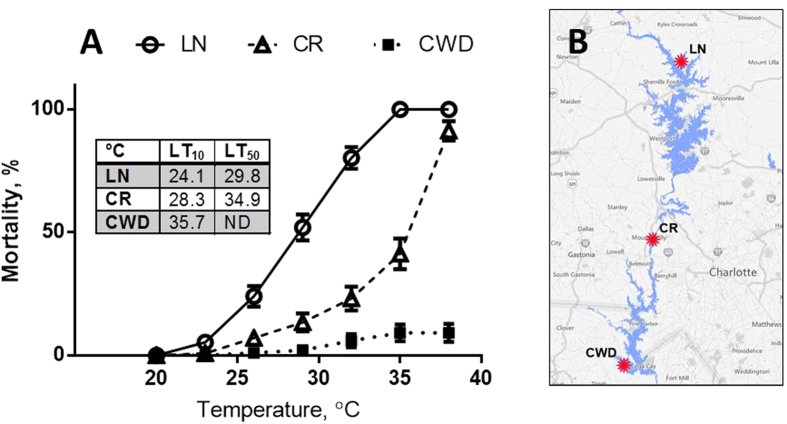
Figure 1. Mortality of C. fluminea from the three studied sites during acute temperature rise.
(A) – mortality, (B) – geographic position of the studied C. fluminea populations in the Catawba River basin, map data: © 2016 Google. Populations: LN - Lake Norman site, CR – Catawba River site, CWD – cooling water discharge site. Temperature was raised at a rate of 1 °C per hour for 3 hours, followed by a 48 h acclimation period after every 3 °C rise. LT10 and LT50 are the temperatures causing 10% and 50% mortality in the studied populations, respectively. LT50 could not be determined in the CWD clams due to the low mortality rates at the temperatures ≤38 °C and 100% mortality at 41 °C. Vertical bars represent the standard error of estimate. N = 122 for LN and CR, and 119 for CWD.

