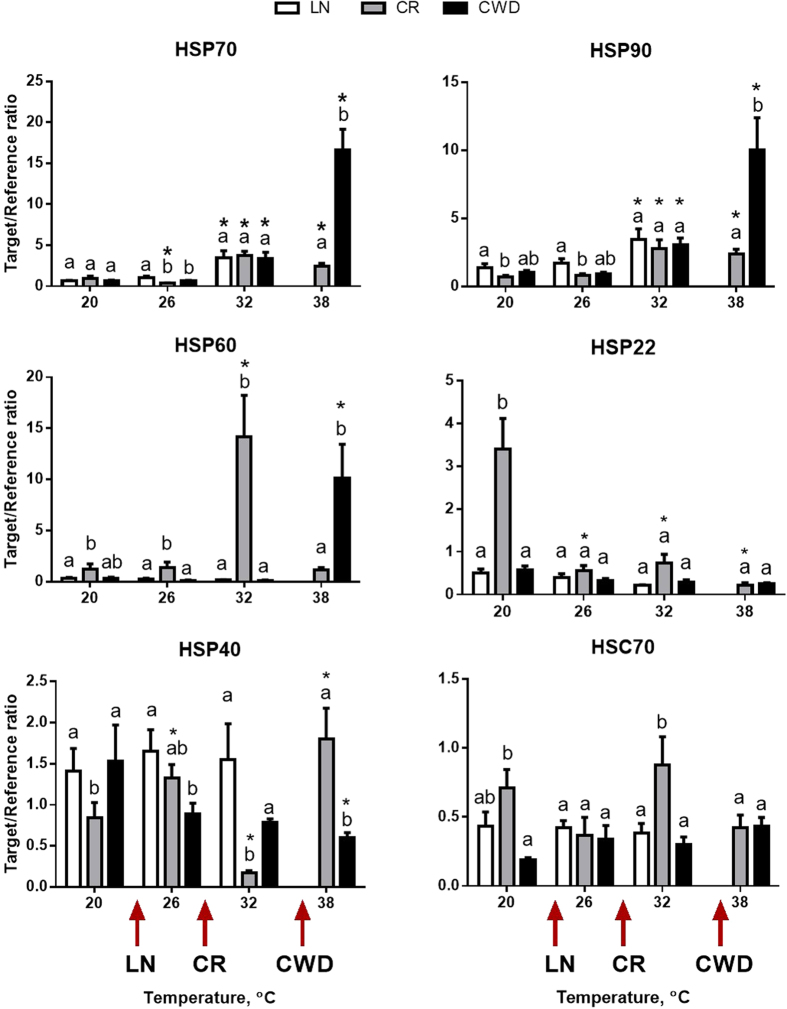
Figure 2. Effect of acute warming on expression of mRNA encoding molecular chaperones (heat shock proteins) in C. fluminea from the three studied populations.
X- axis – exposure temperatures, Y- axis – mRNA levels of the target gene relative to the geometric mean of two reference genes (β-actin and RSP9). Different letters indicate significant differences between the means for different populations (p < 0.05). Asterisks indicate values that are significantly different from the respective control group (exposed at 20 °C) within each population (p < 0.05). Arrows on the X-axis indicate LT10 for each of the studied populations. Vertical bars represent the standard error of means. N = 8–9.

