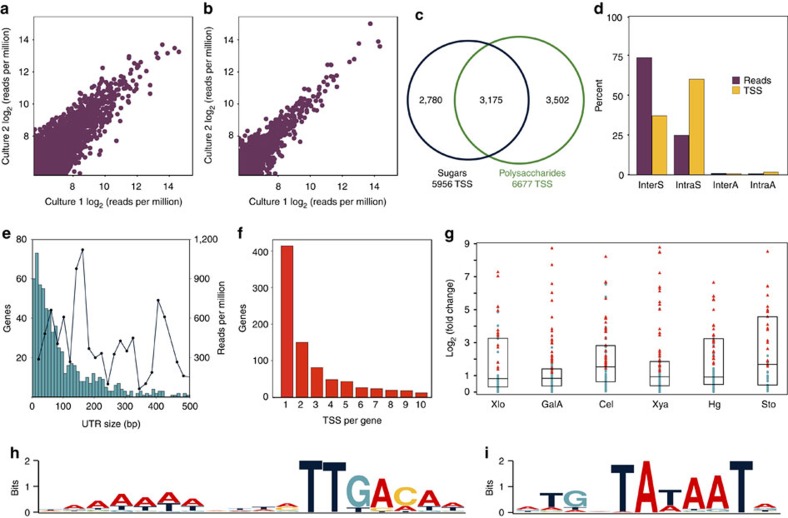
Figure 2. General features of TSS identification by Capp-Switch sequencing.
Capp-Switch reproducibly quantifies TSS usage in duplicate (a) glucose (4,399 TSS; R2=0.96) and (b) stover (1,532 TSS; R2=0.99) cultures. (c) Venn diagram showing overlap of TSS identified in at least one monosaccharide and one polysaccharide or biomass treatment. (d) Percentage of reads (purple) and TSS (yellow) classified as InterS, IntraS, InterA or IntraA summed across treatments. (e) The length of most 5′ UTR (primary TSS to start codon) is <100 bp (blue bars with left Y axis), but UTR length does not correlate with expression strength (black line with right Y axis). TSS strength is the average reads per million for all TSS in a 20 bp 5′ UTR size interval. Results show glucose data. (f) Distribution of the number of InterS TSS per gene for data summed across treatments. (g) Genes with substrate-specific TSS are often differentially expressed. The Y axis is the absolute value of log2 (RPKM substrate/RPKM glucose) from RNA-seq for all genes with InterS TSS specific to that substrate. Substrates are xylose (Xlo n=50 genes), galacturonic acid (GalA n=146 genes), cellulose (Cel n=94 genes), xylan (Xya n=91 genes), pectin (Hg n=119 genes) and stover (Sto n=48 genes). Symbols: red triangles are differentially expressed genes, blue circles unchanged genes, box shows median and interquartile range. Promoter regions upstream of TSS expressed on three sugars and polysaccharides show consensus (h) −35 and (i) −10 motifs recognized by RNA polymerase.

