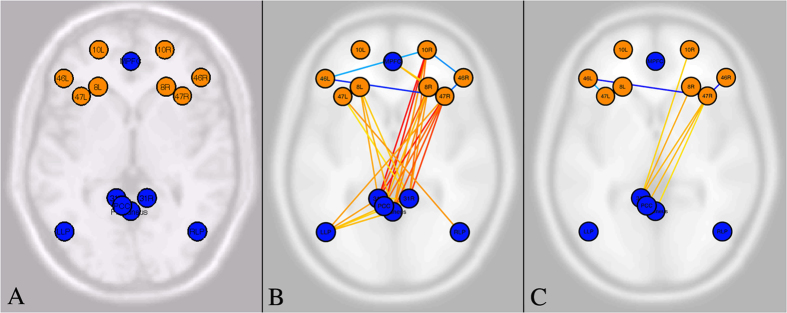
Figure 2. Functional connectivity during creativity.
(A) Regions of interest (ROI) for second level and seed-to-voxel analyses. The nodes selected for the executive control network (orange nodes) were: (a) bilateral anterior dorsolateral prefrontal cortex (10L and 10R), (b) bilateral dorsolateral prefrontal cortex (46L and 46R), (c) bilateral frontal eye fields (8L and 8R), (d) bilateral Inferior frontal Gyrus (47L and 47R). For the default-mode network (blue nodes) we selected: (a) medial prefrontal cortex, (b) three nodes of posterior cingulate cortex (31L and 31R), (c) precuneus, (d) bilateral temporo-parietal junction (LLP and RLP). In the labels for the regions locations in figure, the numbers refer to the corresponding Brodmann areas (e.g., 10 is BA 10), L refers to left hemisphere, and R refers to right hemisphere. (B) Functional connectivity (all participants) between EN (orange) and DMN (blue) nodes in the Creative Task versus Resting State (FDR corr, p > 0.05). Red/orange connections denote increased connectivity in the Creative Task versus Resting State; Blue/cyan connections denote decreased connectivity in the Creative Task versus Resting State. For exact t-values and p-values, see Table 2. (C) Functional connectivity (all participants) between EN (orange) and DMN (blue) nodes in the Creative Task versus Alphabet Task (FDR corr, p > 0.05). Red/orange connections denote increased connectivity in the Creative Task versus the Alphabet Task; Blue/cyan connections denote decreased connectivity in the Creative Task versus the Alphabet task. For exact t-values and p-values, see Table 3.

