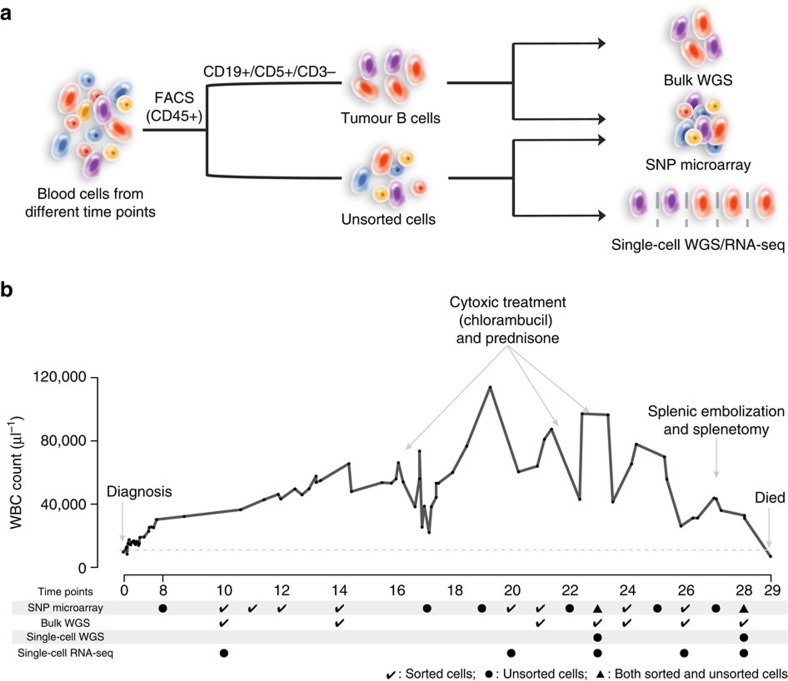
Figure 1. Sample and clinical information.
(a) Schema of the sample isolation and the sequencing strategy. FACS, fluorescence-activated cell sorting. WGS, whole-genome sequencing. RNA-seq, RNA sequencing. (b) Clinical information and corresponding samples analysed. Top, white blood cell counts (WBC) from diagnosis to year 29 following diagnosis. The dashed grey line indicates the normal upper level of WBC. Additional clinical information is shown in Supplementary Fig. 1. Bottom, the matched sequencing samples.

