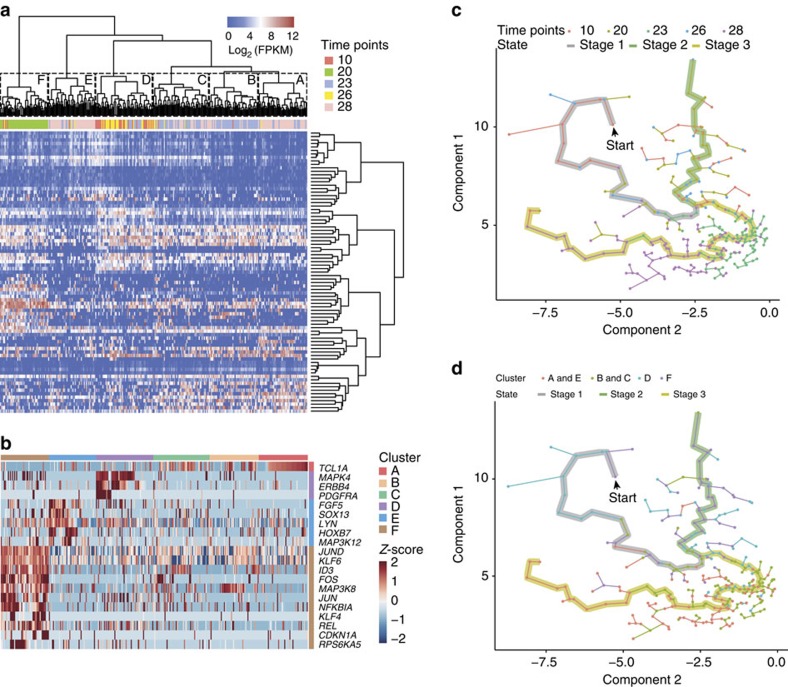
Figure 4. Dynamic changes revealed by single-cell RNA-seq analysis.
(a) Hierarchical clustering of single-cell RNA-seq data from 300 single cells of five time points. Each column represents a single cell, and each row represents a gene. (b) The Z-scores of cells from different time points in different clusters. (c,d) Cell expression profiles in pseudo-temporal ordering. Points represent single cells. Lines connecting points represent the edges of the minimum spanning tree by Monocle program. The thick lines represent the main path of the pseudo-temporal ordering.

