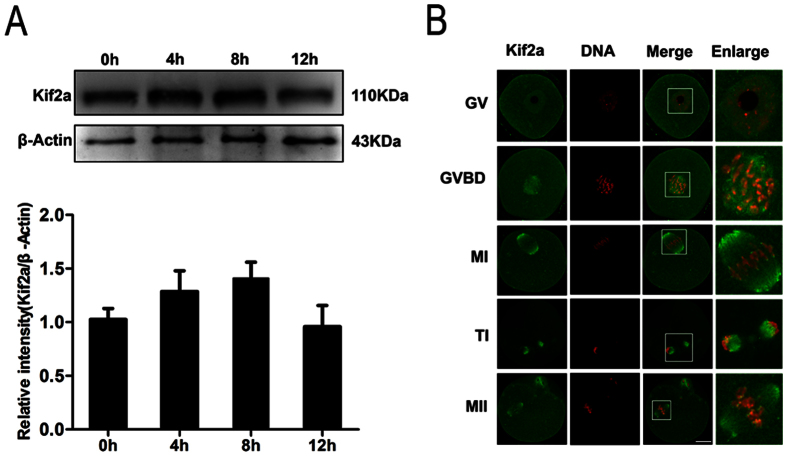
Figure 1. Expression and subcellular localization of Kif2a during mouse oocyte meiotic maturation.
(A) Western blotting results for expression of Kif2a were cropped gels. Oocytes were collected after culture for 0, 4, 8, 12 h, corresponding to the GV, Pro-M I, M I and M II stages, respectively. The molecular weight of Kif2a and β-actin were 110 kDa and 43 kDa, respectively. Each sample contained 200 oocytes. Full-length gels are presented in Supplementary Figure 1. The intensity of Kif2a/β-actin was assessed by grey level analysis. (B) Subcellular localization of Kif2a shown by immunofluorescent staining and confocal microscopy. Oocytes at various stages (GV, GVBD, M I,T Iand M II) were stained with antibody against Kif2a. Green, Kif2a; red, DNA; Magnifications of the boxed regions are shown. Bar = 20 μm.

