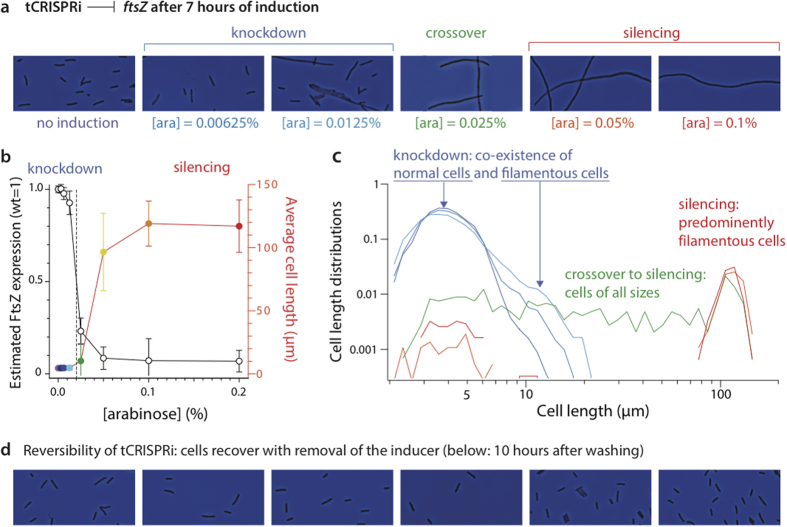
Figure 6. tCRISPRi on FtsZ reveals gene expression level dependent cell division regulation.
Colors correspond to different arabinose concentrations as shown in (a). (a) Use of tCRISPRi to knockdown FtsZ expression to levels below the threshold required for cell division. At low repression of ftsZ most cells are normal, but a subpopulation of cells exclusively filament [see also cell size distributions in (c)]. As the suppression of FtsZ expression increases, all cells become filamentous and do not divide. (b) The threshold transition occurs when the level of FtsZ expression is approximately half the wild-type level. Cell sizes for [arabinose] > 0.05% are likely an underestimate, since many cells were larger than the field of view of the microscopy. The error bars indicate standard deviations of distributions. (c) Cell length distributions in log-log scale show crossover from knockdown (blue) to silencing (red) at [arabinose] = 0.0625% (green), with the cell population showing all lengths from 2 μm up to over 100 μm. (d) Reversibility of tCRISPRi is confirmed as all cells recover their normal size once the inducer is removed from the culture.

