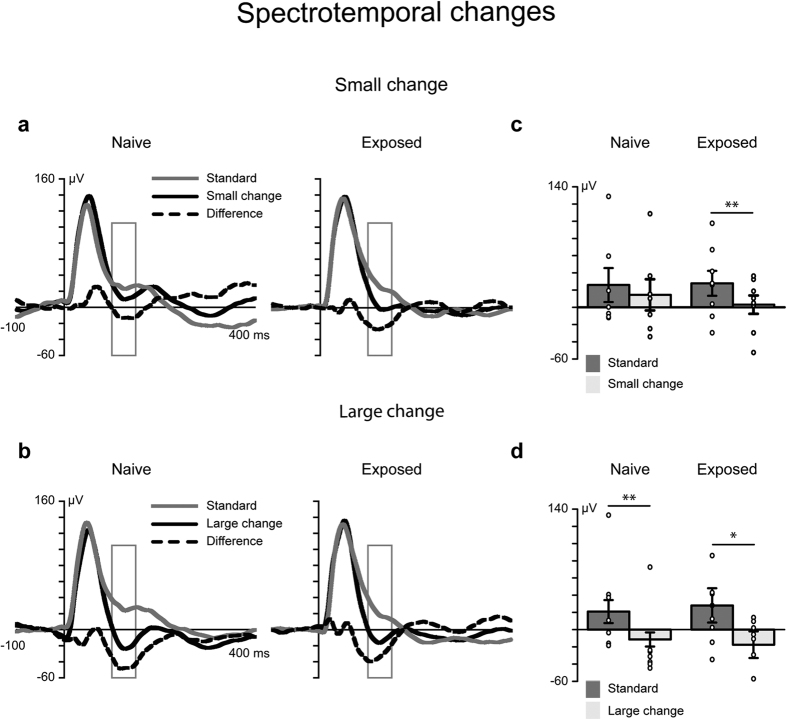
Figure 1. Passive exposure to spectrotemporal changes enhanced cortical responses to the same sounds presented later.
(a,b) The grey line denotes responses to frequently presented standard sounds, and the black line denotes the responses to large or small changes in sound (deviant). The black dashed line represents the differential response (MMN), which was calculated by subtracting the response to the standard sound from the response to the deviant sound. The rectangles show the region of interest (mean amplitude values 100–150 ms after the stimulus onset). A repeated measures analysis of variance (ANOVA) of the factors ‘stimulus’ (standard vs. deviant), ‘deviant type’ (small vs. large change) and ‘group’ (exposed, n = 8 vs. naive, n = 7) revealed a three-way interaction effect: F1, 13 = 4.85, P = 0.046, η2p = 0.272. (c,d) Response amplitudes for each animal (marked with circles) and the error bars indicating the mean and standard error of the mean values, *P < 0.05, **P < 0.01. (c) The small change in spectrotemporal features elicited the MMN response (M = −32.36 μV, SEM = ±10.49) in the exposed animals (t[7] = 3.08, P < 0.009, d = 1.258) but not in the naive animals (M = −11.28 μV, SEM = ±9.16) (t[6] = 1.232, P = 0.264, d = 0.465). (d) The large change in spectrotemporal features elicited the MMN in both the naive (M = −45.61 μV, SEM = ±9.80) and exposed animal (M = −32.36 μV, SEM = ±10.49) groups (t[6] = 4.66, P < 0.003, d = 1.760 and t[7] = 3.08 P < 0.018, d = 1.090, respectively).

