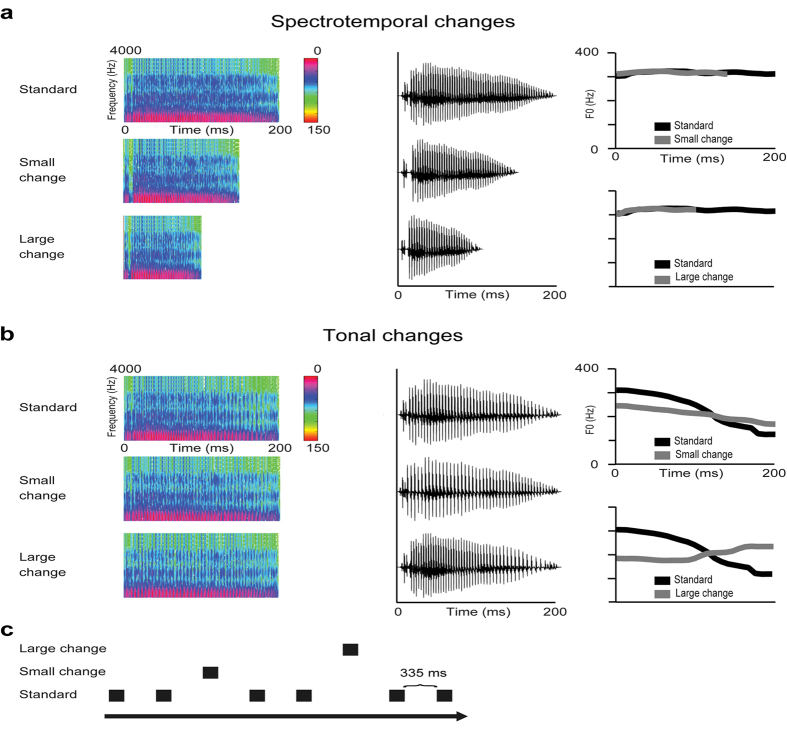
Figure 3. Sounds and the stimulus condition applied in the exposure and test phases.
(a,b) Spectrograms, waveforms and fundamental frequencies of the sounds. The animals were exposed to either spectrotemporal (a) or tonal changes (b) in the vowel/a/. (c) The sounds were presented in an oddball series, where frequently presented standard sounds were interspersed with a large or small change in the sound. After the exposure, the LFPs in response to both stimulus types were measured in all the animals. The sounds were presented in the oddball condition, where frequently occurring standard stimuli (probability of 0.80) were interspersed with two deviant sounds (large or small change, probability of 0.10 each), using E-prime 1.2. software (Psychology Software Tools Inc., Sharpsburg, US). The inter-stimulus interval was 335 ms (offset to onset). The stimuli were delivered in a pseudorandom fashion, with the restriction that consecutive deviant sounds were separated by at least two standard sounds.

