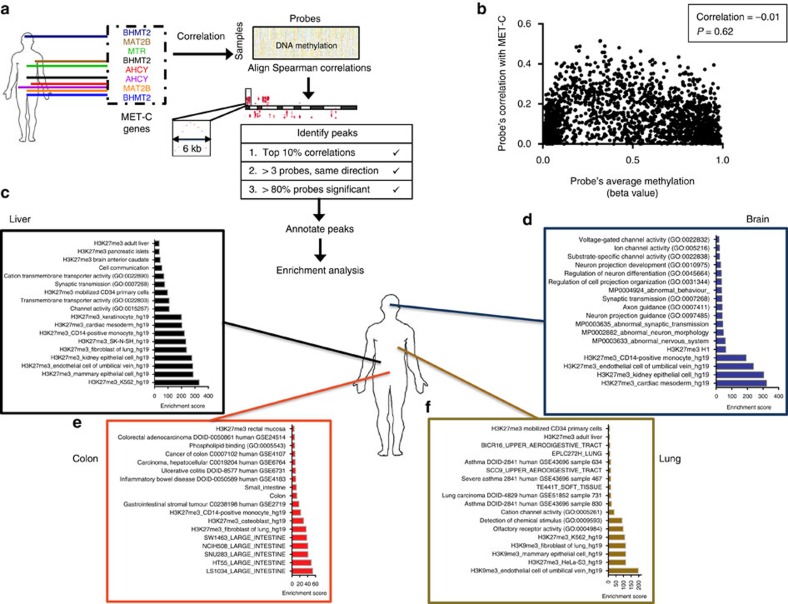
Figure 3. Genome-wide screening for metabolically regulated regions.
(a) Schematic describing the algorithm used for finding genomic regions where DNA methylation might be regulated by the met cycle (see Methods). (b) Assessment of the relationship between met cycle correlation and absolute methylation. The y axis shows the Spearman rho for correlation of 2,000 randomly selected probes with the expression of AHCY in colon cancer. The x axis shows the average methylation level of the same probes across the colon cancer samples in the study (see Methods). (c–f) Pathway enrichment analyses of genes overlapping peaks. Results are depicted by functional annotation of genes located within peaks of correlation between met cycle and DNA methylation (see Methods for description of gene sets and enrichment scores; see Supplementary Fig. 7 for additional cancer types).

