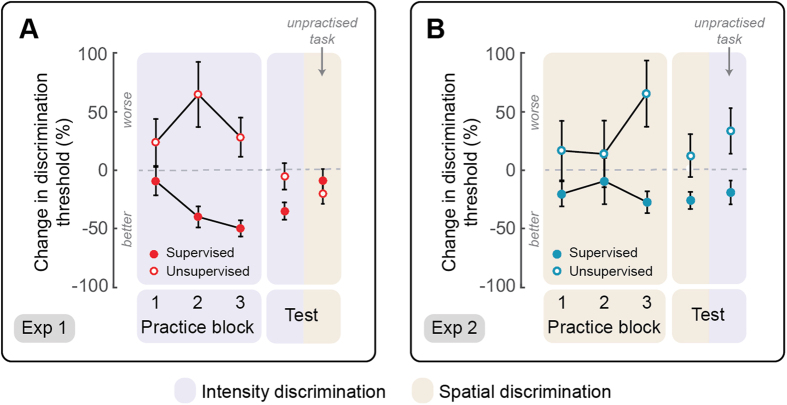
Figure 1. Group results.
The plots display the group average (±SE) percentage change of intensity (purple) and spatial (beige) discrimination thresholds during the first three blocks of supervised and unsupervised practice, and at the +3 h test session. Percent changes of discrimination thresholds were calculated relative to baseline (3 h before practice). Panel A shows results from Experiment 1, in which participants practiced intensity discrimination, whereas panel B shows results from Experiment 2, in which participants practised spatial discrimination.

