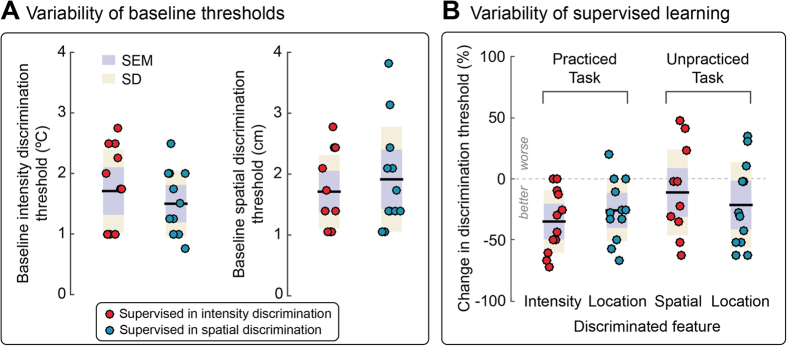
Figure 2. Individual data.
(A) Intensity and spatial discrimination thresholds estimated at baseline (3 h before practice), in the groups that subsequently received supervised training in intensity and spatial discrimination. (B) Percentage change of both intensity and spatial discrimination thresholds, estimated 3 h after supervised practice in intensity and spatial discrimination. Each circle represents an individual participant.

