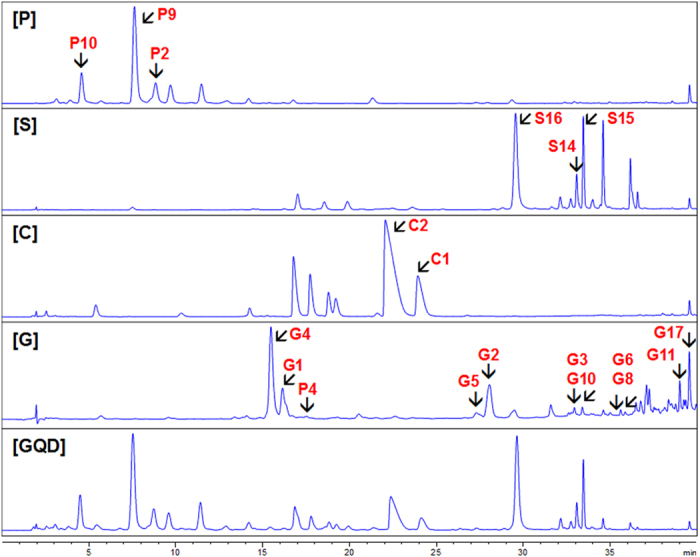
Figure 2. HPLC fingerprints of GQD and its component herbs, showing the single compounds selected for metabolic studies.

P, Puerariae Lobatae Radix; S, Scutellariae Radix; C, Coptidis Rhizoma; G, Glycyrrhizae Radix et Rhizoma Praeparata cum Melle. UV wavelength of P, S, C, G and GQD were 254 nm, 270 nm, 270 nm, 300 nm, and 270 nm, respectively. Black arrows show representative compounds.
